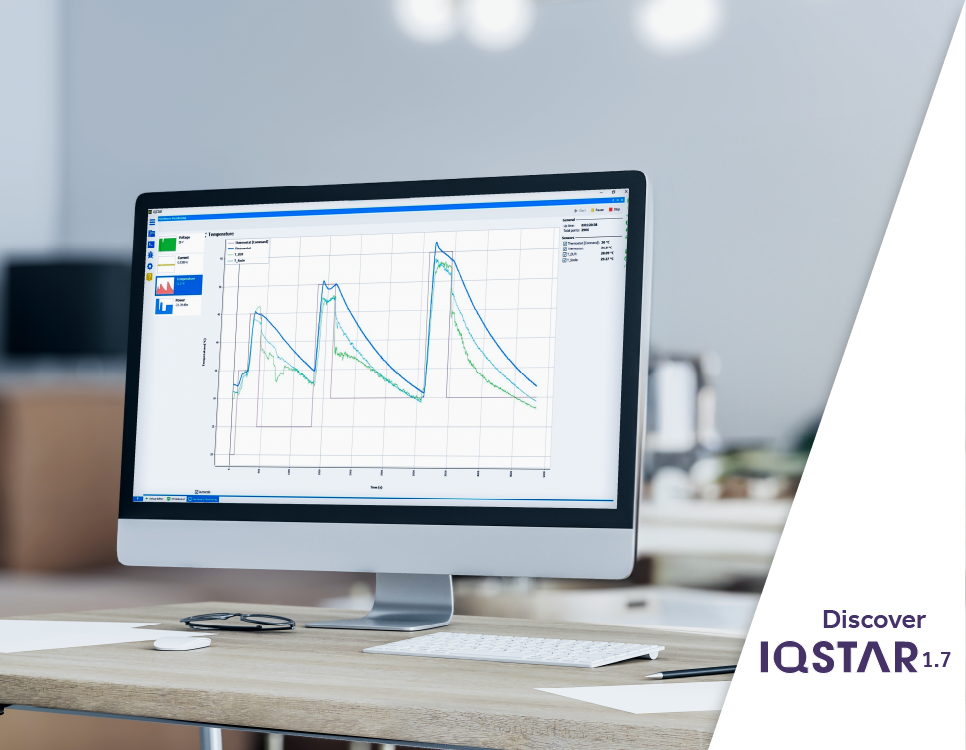
IQSTAR 1.7
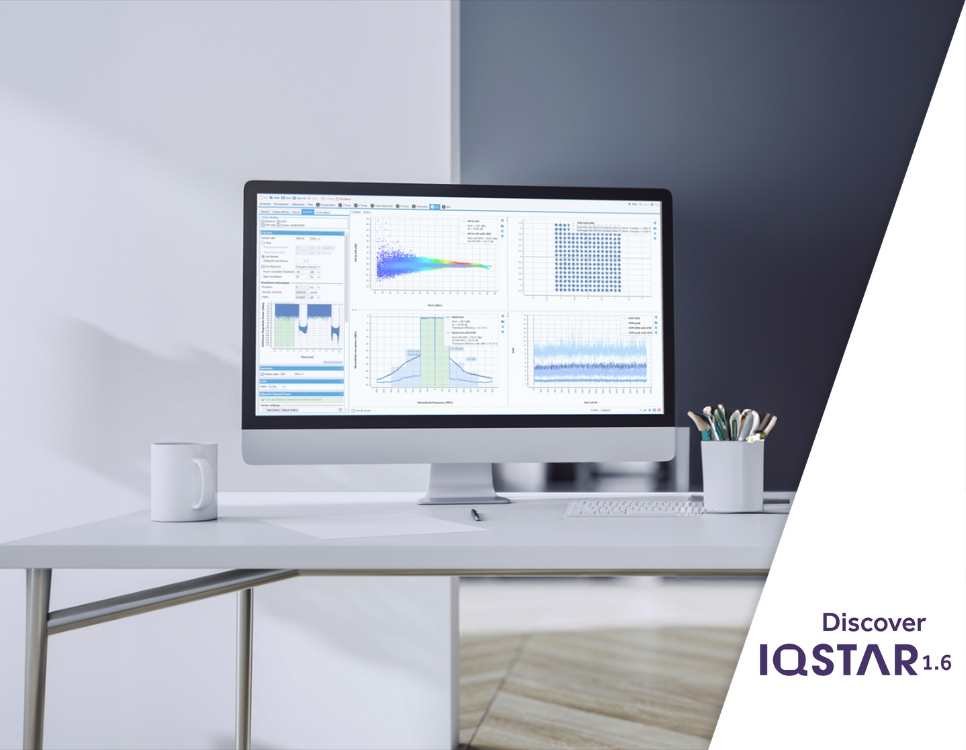
IQSTAR is a software used to perform tests on Microwave and RF circuits.
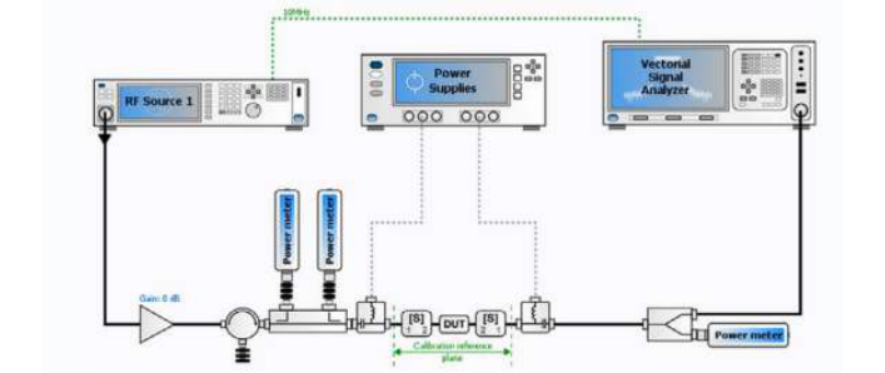
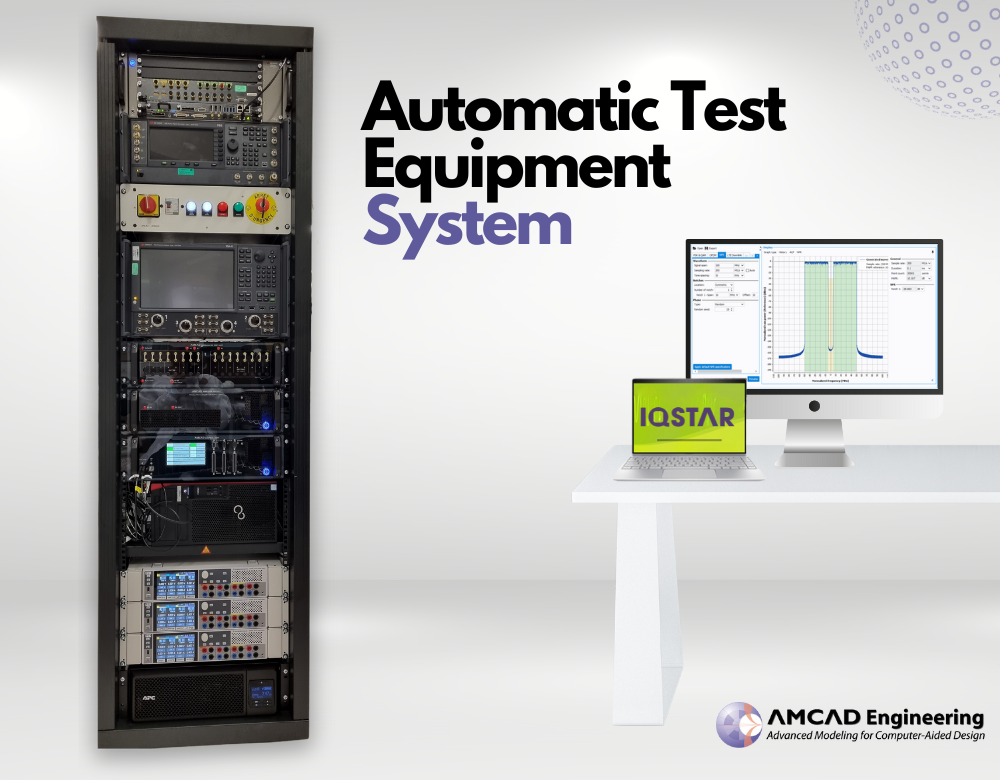
The test benches used in laboratories are generally made up of more than a dozen instruments of different brands and used by several engineers or technicians. It's not uncommon to observe inconsistent measurement results obtained from the same golden device depending on the instruments part of the bench or the person in charge of the measurements. IQSTAR generates indisputable measurement results, regardless of the instruments or people in charge of the tests.
IQSTAR also solves the problems associated with home-made test automation software, which is difficult to scale-up, or to maintain due to staff turnover.
Ask for your IQSTAR licence trial
Download IQSTAR 1.7 brochure
New and enhanced features in IQSTAR 1.7 release