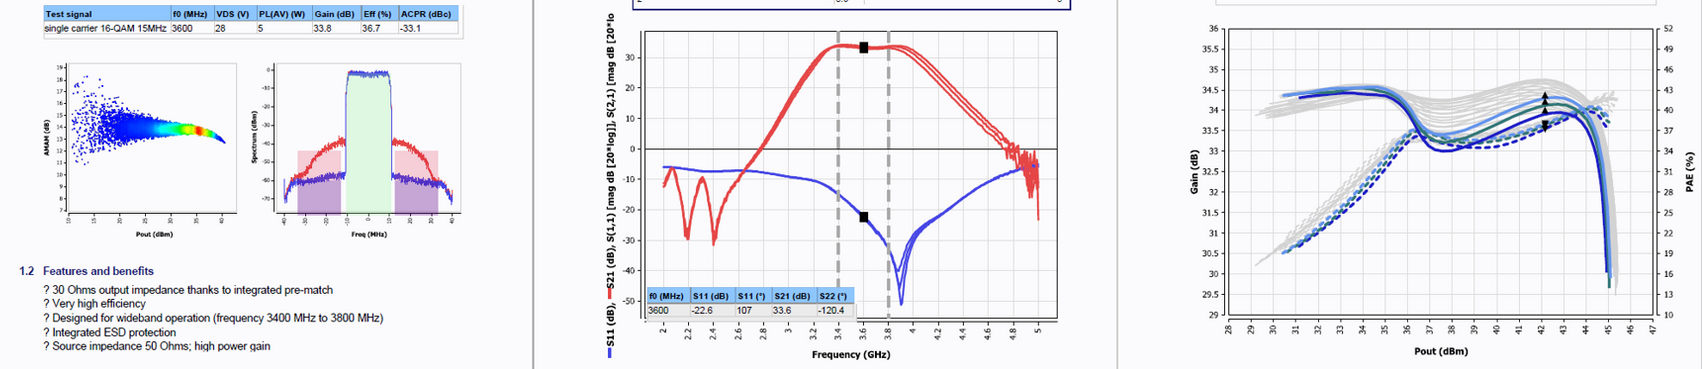
Whiteboard’s Key Features
- Create and customize unlimited RF data analysis templates
- Advanced data Post-processing Tools
- Multiple data illustration controls
- Interactive Reports
What is your preferred software to share RF and microwave measurement results?
- Power point / Excel / Word ?
- Matlab ?
- ADS or MWO templates ?
- Other tools ?
Our perception is that when you ask the question to technicians or engineers, there is generally no consensus. Each tool has its advantages and disadvantages.
The great classic is to favor the presentation of results in power point reports. These solutions have the advantage of being inexpensive and relatively simple to set up. Nevertheless, the reader will not be able to explore the data other than in the form proposed, which greatly limits the exploitation of the information.
The Excel software provides more flexibility, but the graphic tools quickly pose significant limitations, which restricts the exploitation of the results to benefit from the information provided.
The Matlab software sold by Mathworks is the software of choice for engineers, to do some kind of post-processing and displaying graphs of measurement data. Nevertheless, for advanced post-processing for specific areas of expertise, the interactive visualization environment must be developed from scratch, because the default menus are not specifically dedicated to RF measurement management. Some of our clients had developed very advanced templates for analysis, but the maintainability of this tool over time was complex depending on the departures and arrivals of the staff who had participated in the development.
Among the more specialized software for our businesses, powerful templates for viewing RF measurement data can developed using your preferred RF circuit simulators. Nevertheless, this forces anyone who wants to analyze the measured data to use a circuit simulator which is an overkill for such an application. A simulator is priced to run simulations, not to manage your measurement data. And if your counterpart do not have the same simulator, you will not be able to share your work.

AMCAD has been providing measurement services on RF components and circuits for many years. To respond to these different challenges, we have developed a software that incorporates the strengths of the different solutions listed here, while overcoming the problems. From a blank page, our engineers design in a few clicks tailor-made visualization environments according to our customer demands, that vary from for each service.
This solution takes benefit of all the predefined features related to the engineering work in RF and microwave engineering. Cherry on the cake, dynamic reports are shareable within a team.
Features :

The Whiteboard supports different measurement data in several formats given by IVCAD, IQSTAR, or third-party measurement platforms. When using simulation tools such as VISIONor third-party RF simulators, data files can be multidimensional with customized parameters. Because of the potentially unlimited number of dimensions explored during the simulation work, the Whiteboard is an unrivaled tool when both flexibility and performance are needed to extract the files’ core information.
Using a multipage structure, the analysis tool offers the possibility to arrange the workspace in dedicated sections for an enhanced user experience. The user has full control of each graph’s position, and size and the interface can be enhanced with explanatory text, banners, and images to make the analysis experience clearer and more user-friendly.

When the WHIT10 Whiteboard Editor generates a new iteration of the template, the WHIT11 Deployment tool helps the user share it among colleagues to standardize the data analysis process, or with customers in the format of an interactive report. This option offers a competitive tool that supports a company’s growth by providing the right means to complete the work and provides an evolutive solution in a timely manner.

By generating a customized template, the editor provides an enhanced team experience when using the company’s data. He also decreases the time wasted by his team in managing the data because the post-processing template is already qualified and ready to be used by the group. The deployed Whiteboard Viewers are multiple copies of the workspace. The number of copies is managed directly by the editor. By sharing all the interface’s interactive capabilities applicable to an unlimited number of datafiles given by a simulator or a measurement bench, the team experience is greatly improved as the viewer tool streamlines everyone’s data workflows.
For these reasons, AMCAD engineering developed the WHIT30 Free Workspace Viewer module. Interactive measurement reports are few clicks away enabling customers to analyze the data far beyond what a static report can offer. Report templates can save time, where a simple selection of the data file populates all the graphs and tables in the final report with the new values. This way, the application engineer can spend more time on his work, and the colleagues and customers can have access to all needed data to appreciate the end product.

Note: Contrary to the WHIT20 viewer module, the data in the WHIT30, Free Workspace Viewer, is hardcoded inside the interactive report. The reader does not have access to the original data. He will only be able to tune the parameters made available by the editor to refresh the different graphics and tables.

The WHIT10 Whiteboard Editor can be empowered using the SCRPT scripting module. The scripting Add-on was developed for advanced users who are willing to customize their interface and templates beyond what is available with the configuration panel. The scripting mode enhances the whiteboard solution with a script editor where all the Whiteboard functions used to configure the workspace are made available to customize. Therefore, complete flexibility of the configuration can be automated by script.
Want to see how this can apply to your working method?
Download the Whiteboard tool