Power Amplifiers are active circuits used in multiple RF and microwave systems for various applications like wireless communication, Broadcasting, Radar, RF heating and more.
Depending on the application for which the Power Amplifier is designed, its characteristics are optimized to achieve the specifications of the overall system.
Power Amplifier Characterization is an important step in the qualification of a design. The parameters needed to be measured include:
- Output Power
- Gain
- Efficiency
- Harmonic content
- Linearity
- Spurious
- Ruggedness
Scalar Setup for Power Amplifier Characterization
Basic Power Amplifier measurements can be done using a scalar setup. An RF source generates the signal according to the user specifications. Power sensors measure the power levels at the input and output of the DUT, leading to the gain calculation, and a Spectrum Analyzer handles harmonic spectrum, Spurious-related measurements.
Power supplies are also needed to bias the DUT and measure the Voltage and Current consumption, leading to calculating the dissipated DC Power and Efficiency. The number of power supplies and measurement units depends on the number of stages composing the Power amplifier.
A Schematic editor easily adapts the setup to the measurement bench, allowing flexibility in adding or removing instruments depending on the needed parameters.
Depending on the application, power amplifiers may need to be characterized under pulse stimulus conditions. The Chronogram is a user-friendly graphical interface that allows the setting of the pulse timings and the configuration of associated instruments automatically, reducing considerably user-related manipulation errors.
The calibration of the bench is simplified thanks to a step-by-step wizard, ensuring a standard process, and reliable and consistent test results from one test bench to another, regardless of the instruments used or the person in charge of the measurements.
Scalar measurement benches are cost-effective for power amplifier characterization. It enables 1-Tone and 2-Tone in CW and Pulsed mode measurements. IQSTAR modules can advantageously drive such benches.
Vector-based measurement setup for Power Amplifiers Characterization
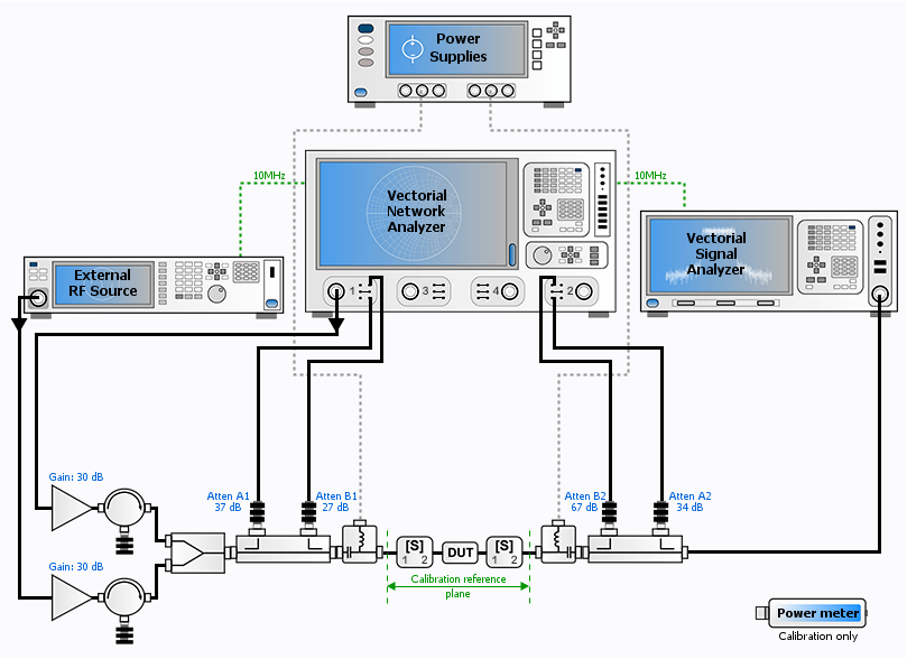
Configuring a measurement setup requires special attention to the power budget to protect the instruments. When dealing with high-power or high-gain power amplifiers, the use of attenuators to protect the power sensors is necessary. But due to the limited dynamic range of power meters, the characterization of such power amplifiers becomes challenging.
Beyond the instrument’s sweep speed, one can take advantage of the Vector Network Analyzer receivers’ dynamic range to increase the accuracy of the measurements. Using dual directional couplers connected to the ports of the DUT, the same setup configuration allows small and large signal measurements through the amplitude and phase of the incident and reflective waves at the ports of the power amplifier. This bench configuration allows a complete characterization by extracting parameters like:
- S-Parameters
- Delivered Power
- Power-added efficiency (PAE)
- Input impedance
- Input return loss
- Power gain
- AM to PM conversion
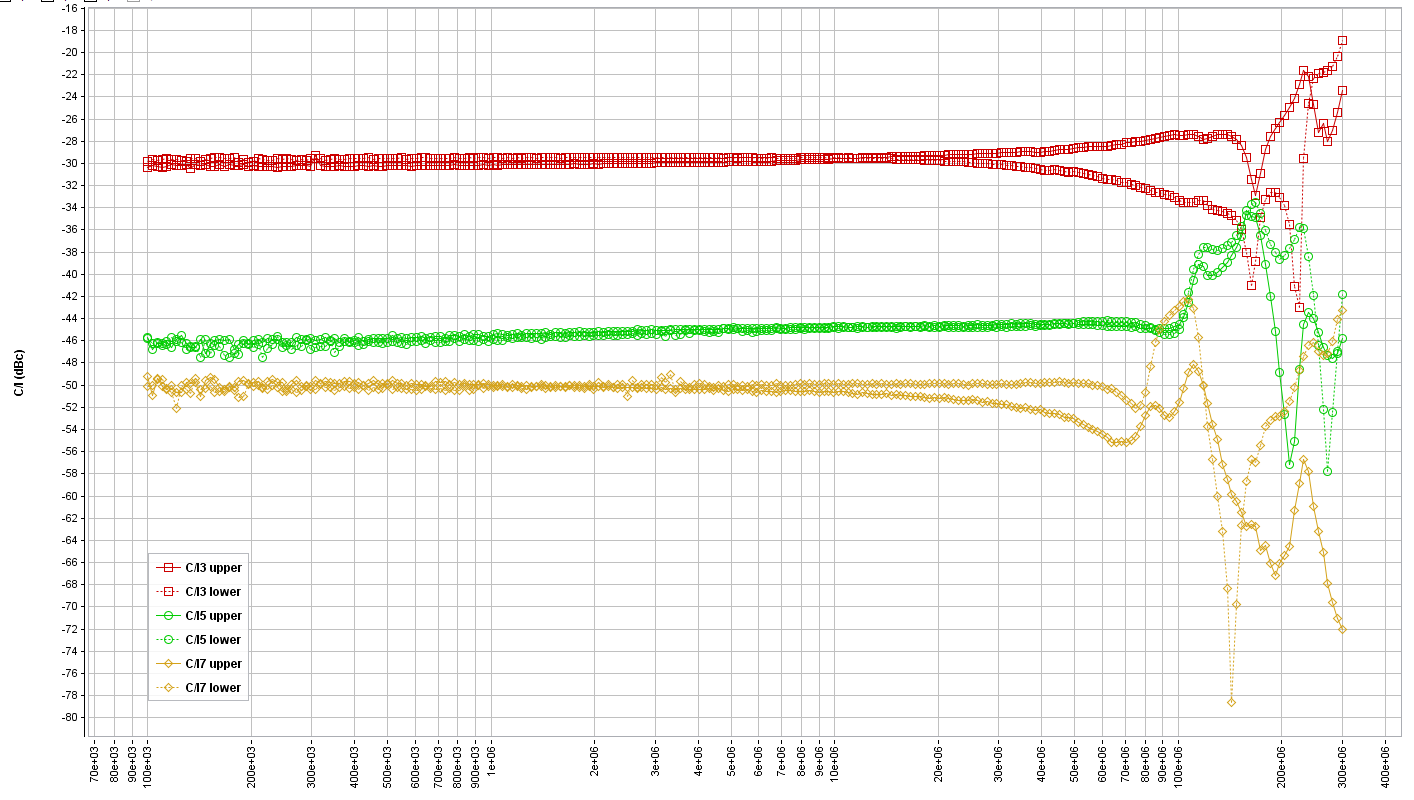
A 2-Tone signal can also be analyzed with such a configuration. Using a vector setup for IMD measurements is even recommended because it allows real-time optimization of the two tones levels when sweeping the tones spacing, power level or center frequency. In some cases, taking advantage of multiple sources inside the VNA can reduce the footprint of the setup.
IQS100B-11 module of IQSTAR, is an add-on to the scalar setup to take advantage of all the capabilities of the VNA.
Real-time measurement visualization
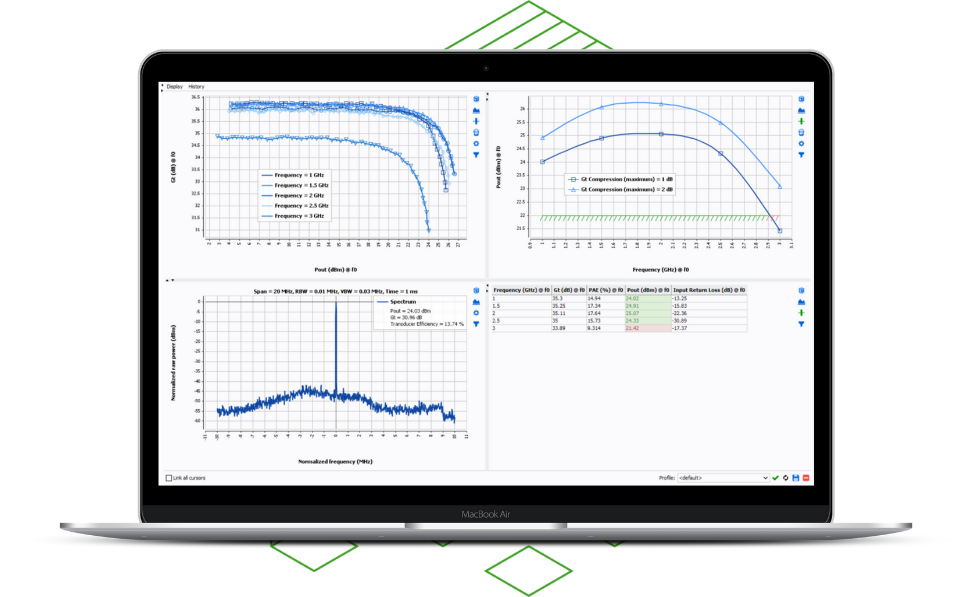
With the increasing number of measurements to characterize and qualify a power amplifier, test engineers must be able to detect defects at early stages. Consequently, a live data visualization tool must be able to plot curves and traces and display data tables, clearly indicating pass/fail criteria.
The live visualization tool in IQSTAR offers customizable displays saved by test engineers for their different characterization steps. Different filters are available to visualize the data at specific stimulus or compression conditions during and after the measurements.
Measurement data are also available for post-processing in different formats like *.csv and *.mdf on top of the IQSTAR proprietary format *.imx.
Automated measurements
Taking advantage of the capabilities of IQSTAR in configuring one setup for multiple measurement types, the automation of the bench becomes important. Sequencing multiple measurements at different conditions (bias, temperature, devices…) allows the test engineers to standardize the tests across the labs and sites and ensure a systematic correlation between the measurements.
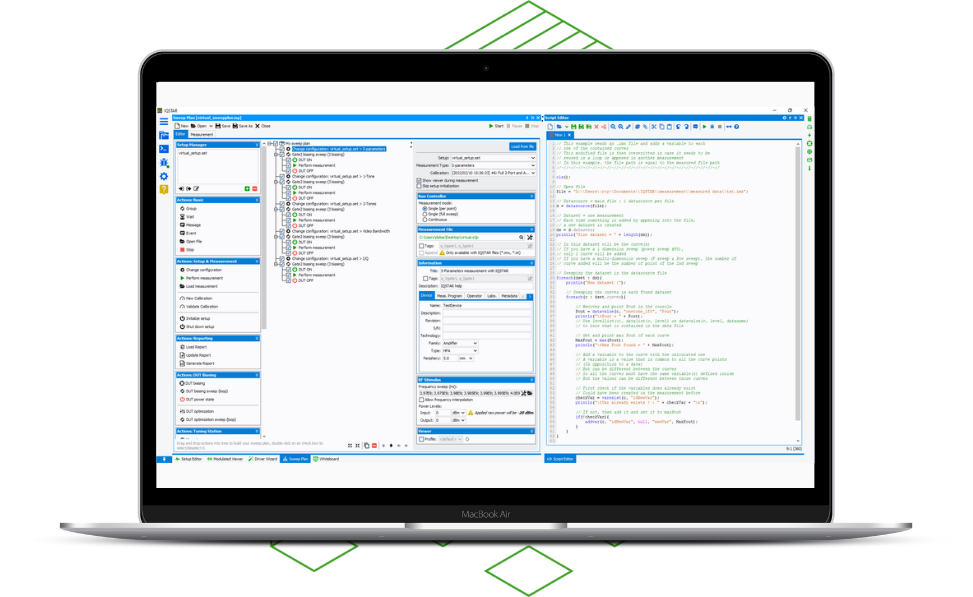
The Sweep Plan in IQSTAR presents capabilities that enable the following:
- Single-setup and multi-setup configurations
- Measurement sequencing with loops and stop conditions.
- Nested measurements sweep
- DUT bias control & optimization
- Probe station control allows full wafer mapping
- Chuck temperature control
- SCPI commands for specific instrument control during the automation
- Possibility to save sweep plans with all parameters for future use
For more advanced automation, the scripting module of IQSTAR enables advanced measurements and sequencing using a dedicated scripting language and running applications from third-party software.