Hardware monitoring
The hardware monitoring tool is used to monitor several instruments defined in the setup
over time. This can be usefull to supervise ON/OFF biasing sequence, temperature and/or
pressure variation, power glitch, variation or failures over time. It is accessible from
the icon ![]() or from the shortcut located in Measurement >
Hardware Control, once the bench is initialized.
or from the shortcut located in Measurement >
Hardware Control, once the bench is initialized.
Once the bench is initialized, press  to open the configuration windows.
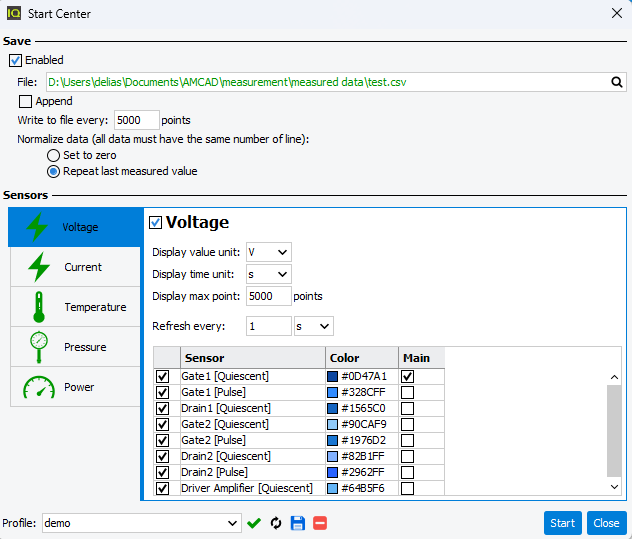
- Save file: this section allows to define the recording
configuration.
- Enabled: allows to enable the save of the monitoring data in *.csv file
- File: define the saved file name and path.Note: if the file name doesn't exist, it will be colored in green. If the file name already exist is will be colored in orange. In this case, the file can be appended.
- Append: allow to add data to an existing file.Note: When a file is appended, the time vector is continued, taking into account the original timestamp of the file.
- Write to file every: define the saving rate in number of
points.Note: Saving is triggered when the fastest (lower refresh time) instrument monitorized reaches this number of points.
Example: two instruments with 5000 pts saving rate
- Voltage with 1 second refresh time
- Temperature with 0.1 second refresh time
This will save voltages and temperatures in the file as soon as the time reaches 500 seconds (5000 pts x 0.1 sec) - Normalize data: when recording rate is different between two instrument families, data vector length must be equal. Select the normalization rule between normalize to zero or to repeat last measured value.
- Sensors selection: this section allows to define data to monitor
over time.
- Each instrument family can be enabled or disabledNote: The higher the number of instrument to be monitorized will be, the slower the measurement will be.
- In each instrument family the display value unit, display time unit,
maximum number of point to display can be defined.Note: The maximum number of points to be displayed automatically affects the amount of allocated computer memory (RAM).
- Refresh every : Each instrument family can have its own "measurement refresh time". (For example, temperature can be measured every second while voltage is measured every 10 seconds).
- Sensor selection:
- In each instrument family, each sensor can be individually enabled.
- Display curve color can be defined individually for each
sensor.
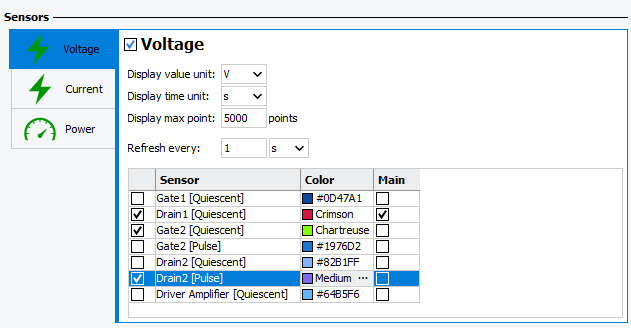
- Main: for each instrument family a "Main" sensor can be defined to be the sensor displayed in the miniature plot.
- Each instrument family can be enabled or disabled
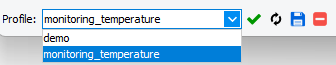
- Monitoring profile: when monitoring tool is correctly set, save
the setting in a profile at the bottom right of the window. Thanks to the list,
check, refresh, save and delete button, it is possible to manage profiles.
Profiles are also available in the Sweep Plan.
to launch the monitoring.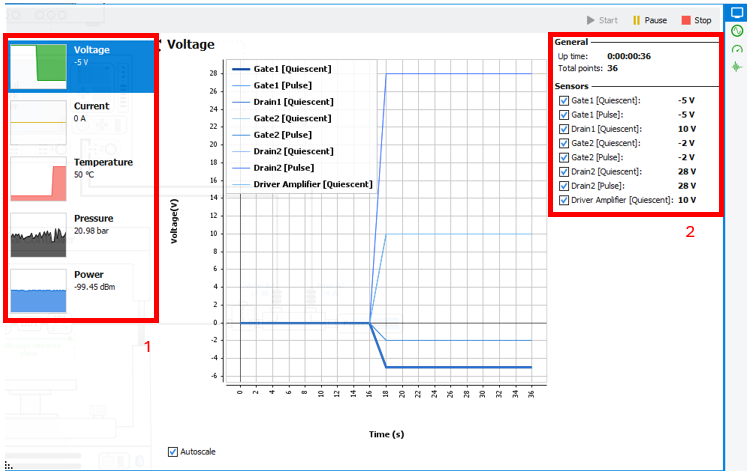
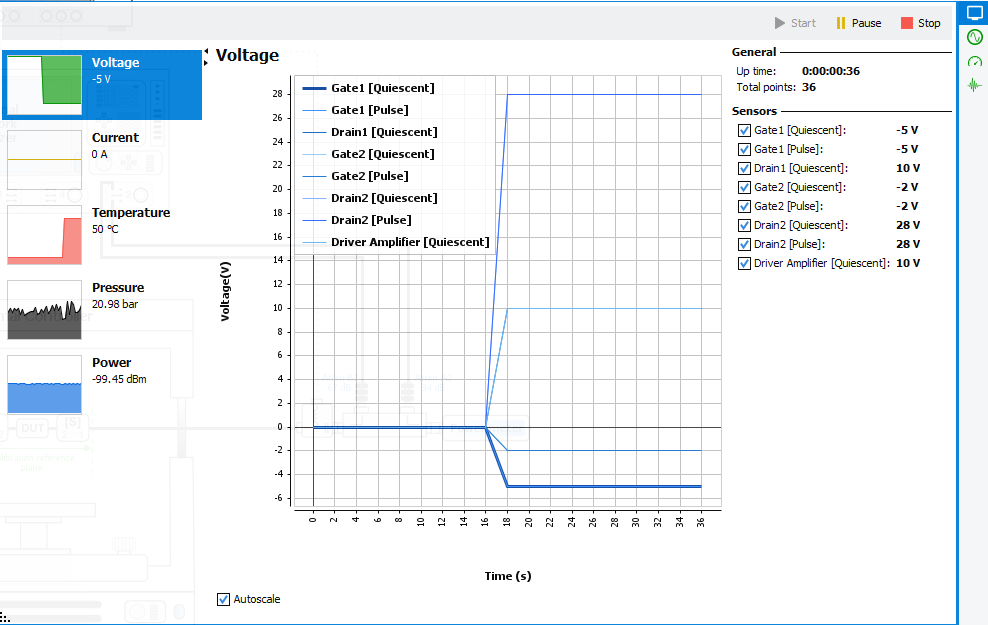
On the left side (1), miniature plots allow to select instrument family in the main graph.
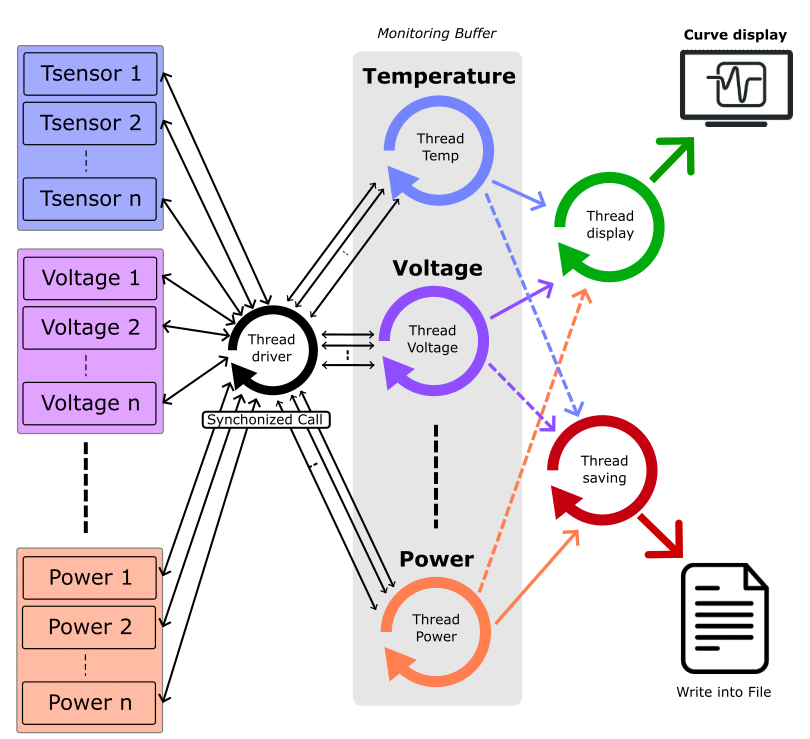
Threading process