
Chronograms
If "Pulsed" mode is selected for the DC bias or the RF, a visual overview of the timings is generated in the Chronograms. It is also possible to re-adjust the timings directly from this window in order to synchronize pulsed RF, Pulsed Power Supplies and Pulsed and Quiescent IV Measurements.
All these information (pulse delays, pulse width, period) can be entered in the schematic. However, for easier handling, all these data can be displayed in the Chronograms window. Using the settings previously defined, the Chronograms will be displayed as hereafter. The mouse cursor can also be used to move manually the timing in the Chronograms window. The middle button need to be kept pressed over the stars and moved.
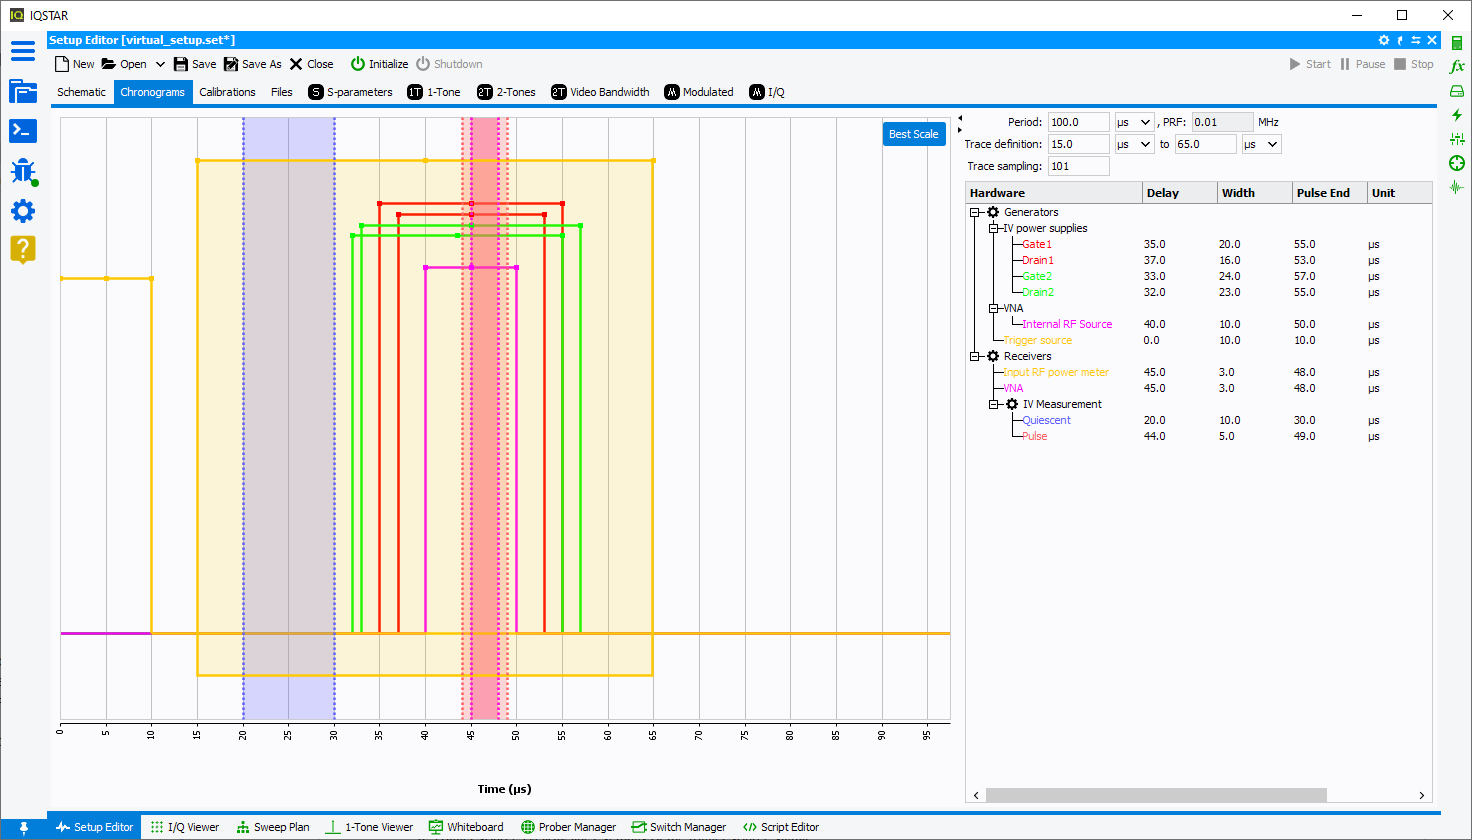
- Generators: include all the instruments generating pulsed signal (Power Supplies,RF Source, Trigger Source)
- IV power supplies (red, green lines): settings of the pulsed bias
- RF source (pink lines): settings of the pulsed RF signal
- Trigger source (yellow line): settings of the trigger source signal
- Measures: include all the instruments measuring in a triggered window (Vector Network Analyzer,IV Measurement,
Power Meter)
- Input RF power meter (yellow window): settings of the input power meter measurement window
- Output RF power meter (brown window): settings of the output power meter measurement window
- VNA (pink windows): settings of the VNA measurement window Note: This window setting is only available in NBF Gated or WBF filter mode
- IV measurements
- Quiescent (blue window): settings of the quiescent measurement window
- Pulse (red window): settings of the pulsed measurement window
- Trace Definition: In the timing editor, the measurement window is highlighted by the yellow area, which corresponds to the equivalent oscilloscope screen, or to the equivalent PIV screen when activating the screenshot menu. This parameter is named “trace def”.