I/Q Real-Time Measurement Display
The configuration of windows display, history, visualization profile and Graph Configuration for modulated signal graphs is similar to 1-Tone Real-Time Measurement Display.
Unlike Modulation Measurements, all graph data and graph types are automatically available
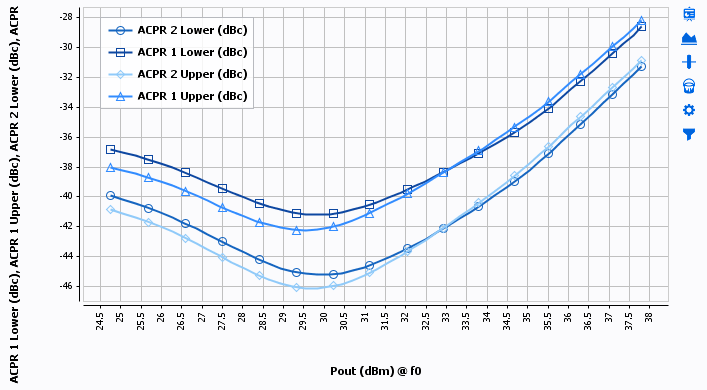
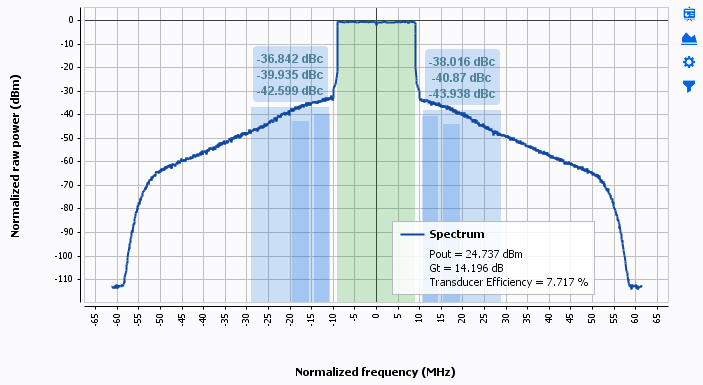
Adjacent Channel Power Ratio (ACPR)
Regarding the definition of the ACP template, IQSTAR displays ACPR (lower/upper) for each adjacent channels described.
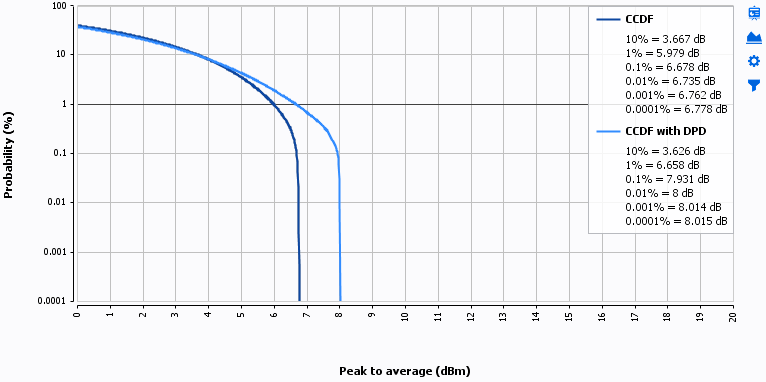
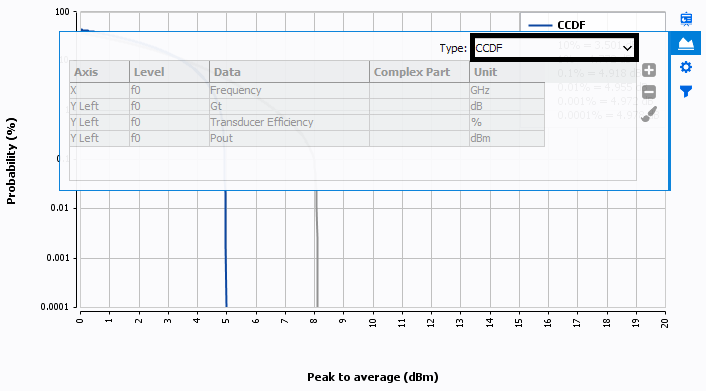
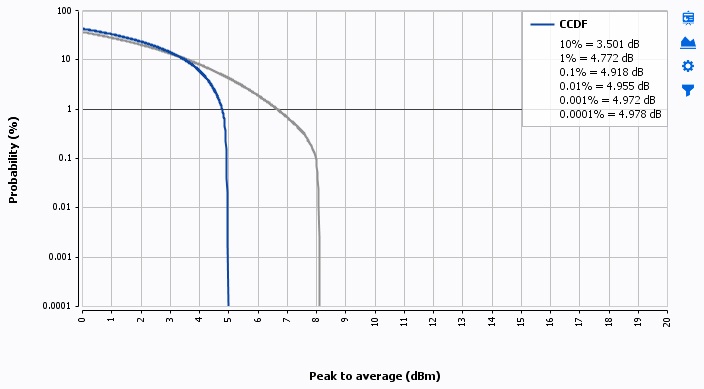
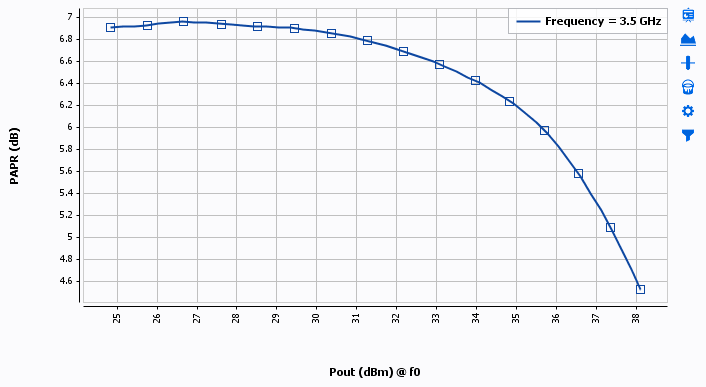
Complementary, cumulative Density Function (CCDF)
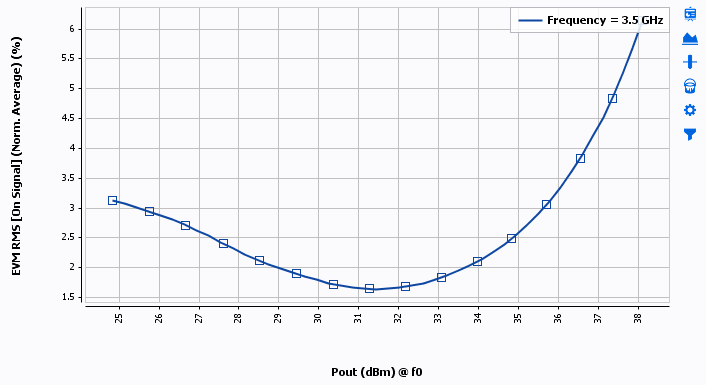
Error Vector Magnitude (EVM vs TIME trace & EVM data).
EVM vs TIME trace needs a special type of graph to be displayed. In order to see the EVM vs time during the measurement selecTrace Graph Mode then EVM vs Time in theGraph Configuration :
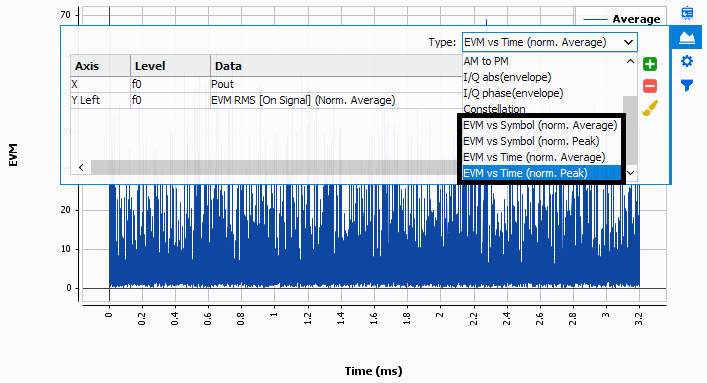
- EVM Reference: RMS and Peak values
- EVM Average: RMS and Peak values
- EVM Peak: RMS and Peak values
- Modulation Error Rate (MER): RMS and Peak values
- Magnitude error: RMS and Peak values
- Phase error RMS: and Peak values
Error Vector Magnitude (Constellation trace).
Constellation trace needs a special type of graph to be displayed. In order to see the EVM constellation during the measurement select Trace Graph Mode then Constellation in theGraph Configuration :
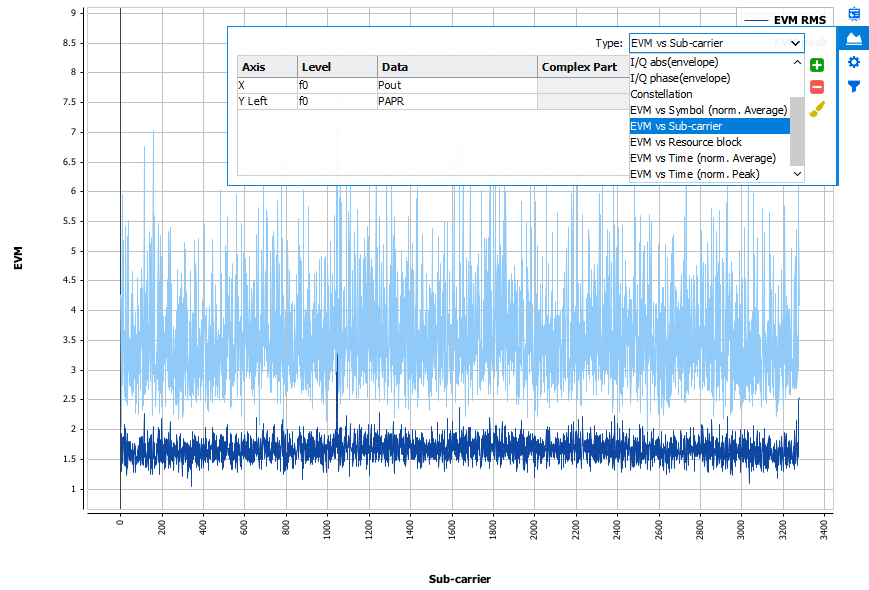
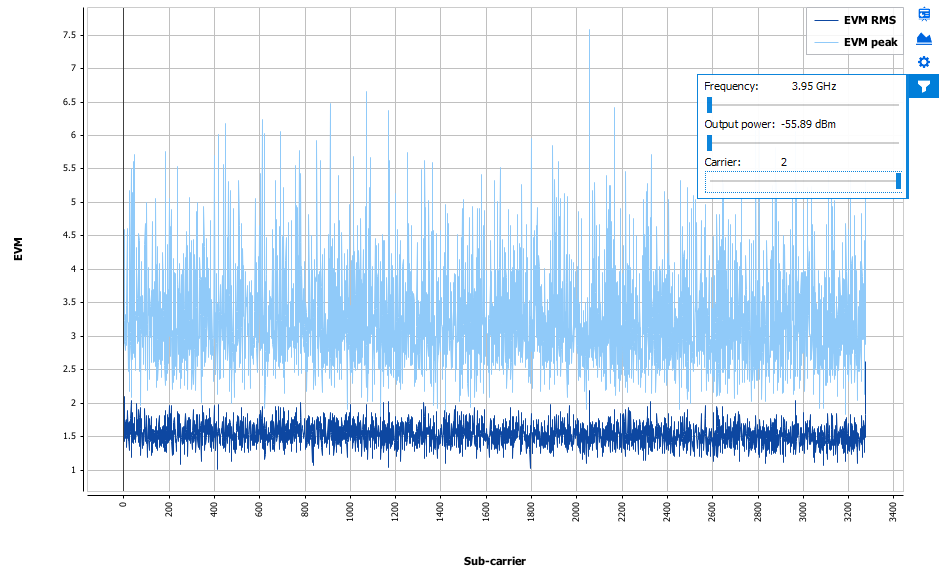
Error Vector Magnitude (EVM vs Sub-carrier, EVM vs Symbol, EVM vs Ressource block)
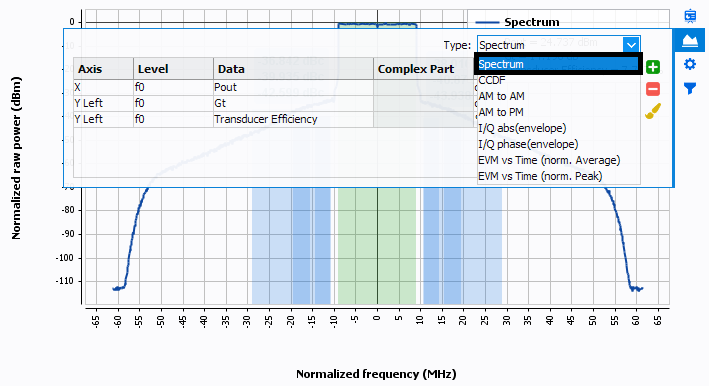
Spectrum
If 'Spectrum' is configured, IQSTAR will display the baseband signal. Notice that Spectrum is also a special type of graph, select Trace Graph Mode then Spectrum in theGraph Configuration :
Moreover if the 'Spectrum' measurement is associate with the 'Adjacent Channel Power' measurement, IQSTAR will display the Spectrum and superimpose the ACPR masks.
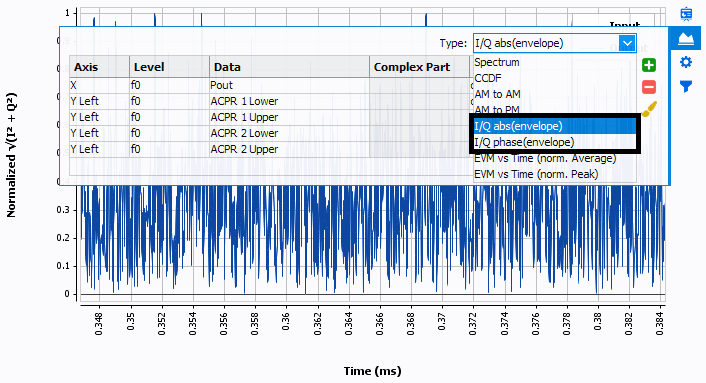
I/Q Data
Selecting I/Q data, IQSTAR is able to display all IQ data versus time. Notice that IQ data is also a special type of graph (IQ abs(envelope) or IQ phase (envelope)), select Trace Graph Mode then IQ in theGraph Configuration :
Moving the output power and/or the frequency slider(Graph Filter), , it is possible to analyze the dynamic AM/AM or AM/PM evolution (expansion or compression) in function of the average output power or frequency.
Dynamic AMAM/AMPM
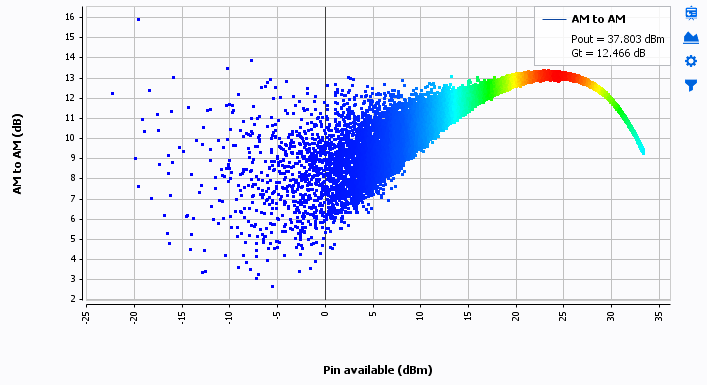
If 'Dynamic AMAM/AMPM' is configured, IQSTAR will display the instantaneous gain of the DUT. Notice that 'Dynamic AMAM/AMPM' is also a special type of graph (AM to AM or AM to PM), select Trace Graph Mode then AMAM/AMPM in theGraph Configuration :
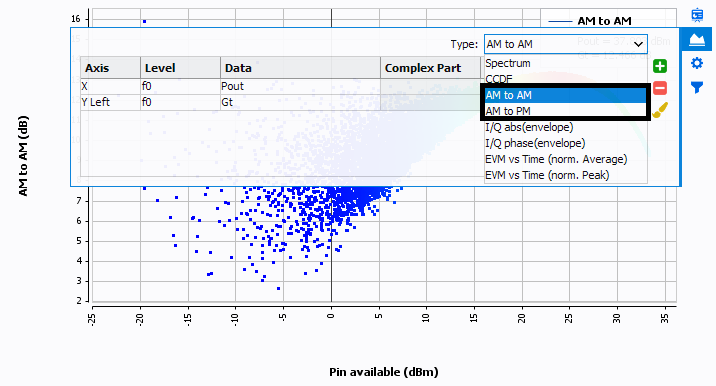
Moving the output power and/or the frequency slider (Graph Filter), it is possible to analyze the dynamic AM/AM or AM/PM evolution (expansion or compression, memory effects) in function of the average output power or frequency.
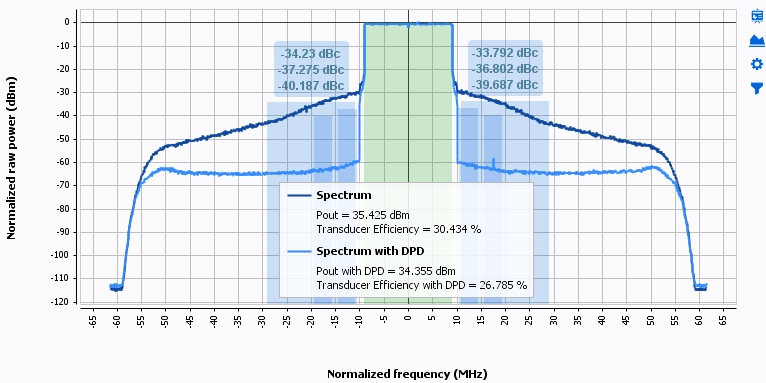
Digital pre-distortion (DPD)
If 'Digital pre-distortion' is configured, IQSTAR will display all the other measurements (Spectrum, ACPR, EVM, Dynamic AM/AM & AM/PM, CCDF …) showing the results with and without DPD.
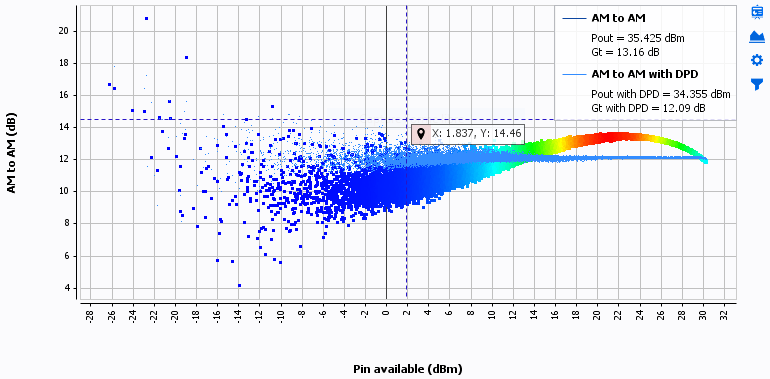
Below an example of a dynamic AMAM with and without DPD:
Below an example of a CCDF with and without DPD: