
1-Tone Real-Time Measurement Display
Configurations such as windows display, history or visualization profile, of 1-tone graph are similar to S-Parameters Real-Time Measurements Display.
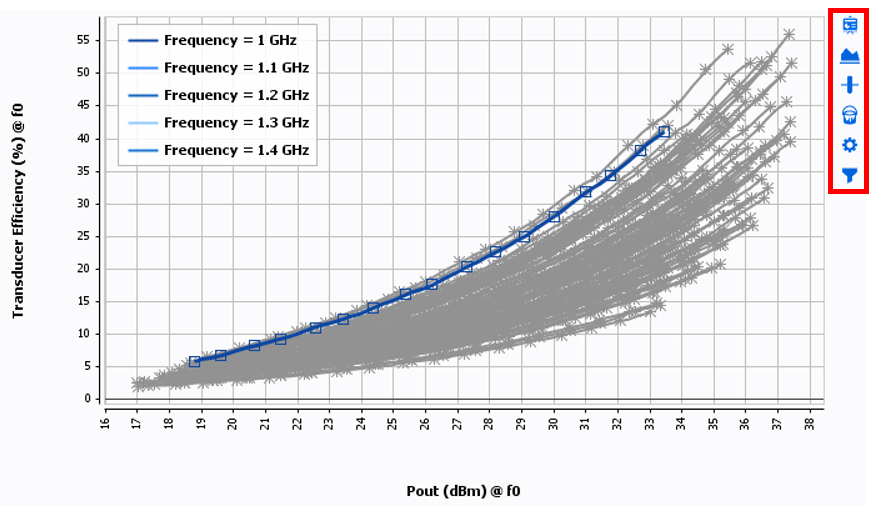
Each graph can be separately configured, using six icons located on the top-rigth side of each graph.
- Graph Mode
 :
Graph 2D, Contours 3D, Sub-Trace, Table
:
Graph 2D, Contours 3D, Sub-Trace, Table - Graph Configuration
 :
Graph Type, Data Axis settings
:
Graph Type, Data Axis settings - Data at Constant conditions
 Plot
data @XdB gain compression, @YdBm output power, @Max PAE ...
Plot
data @XdB gain compression, @YdBm output power, @Max PAE ... - Curve Coloration style
 : Set
coloration style.
: Set
coloration style. - Graph Scale Settings
 : Set
graph scale.
: Set
graph scale. - Graph Filter
 :
Select curve to highlight.
:
Select curve to highlight.