Graph Scale Settings
The scale settings are quite simple for the graph:
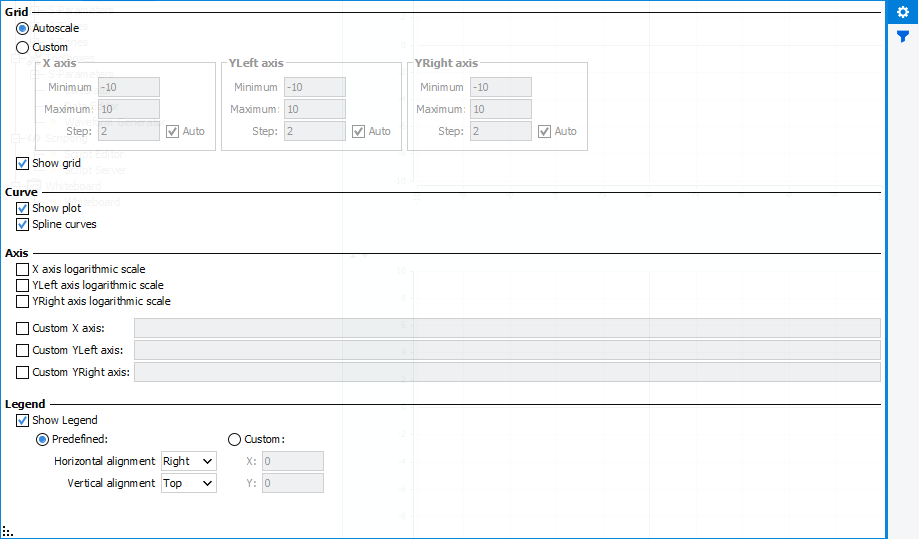
- Grid:
- Autoscale: If checked, the graph will automatically rescale
itself when a new curve is injected. During a measurement, as points are
injected periodically, the graph will rescale itself at each new point
injection.Note: Keyboard Shortcut : ENTER Key
- Custom: If checked, allows to configure the axis min and max values, as well as the grid / labels step.
- Show grid: If checked, the graph grid will be visible.
- Autoscale: If checked, the graph will automatically rescale
itself when a new curve is injected. During a measurement, as points are
injected periodically, the graph will rescale itself at each new point
injection.
- Curve:
- Show plot: If checked, allows the display of the curves
markers.Note: Keyboard Shortcut : P Key
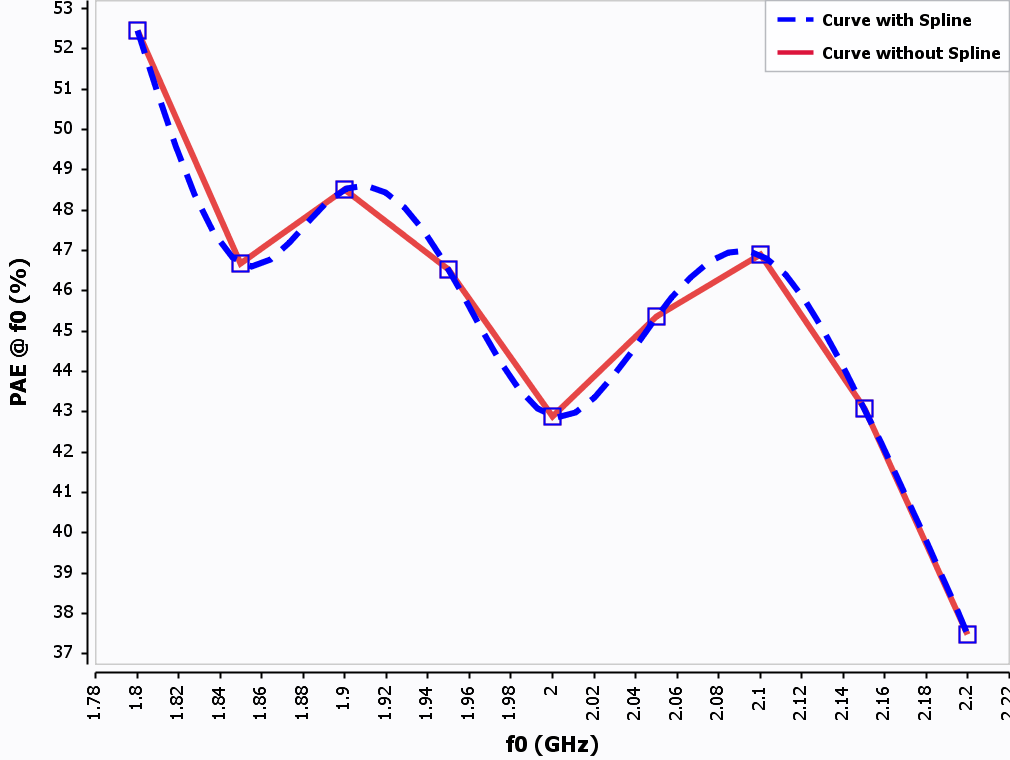
- Spline curves: Allows or not the curve fitting to be represented
as a spline. If not, simple lines are linking points.
- Show plot: If checked, allows the display of the curves
markers.
- Axis:
- X/Yleft/Yright axis logarithm scale: If checked, the corresponding axis will switch from linear graduation to logarithm graduation.
- Custom X/Yleft/Yright axis: Defines the corresponding axis name, overwrites the default one.
- Legend:
- Show legendNote: Keyboard Shortcut : L Key
- Predefined / Custom: Sets the legend location to a specific
place.Note: Keyboard Shortcut : MAJ + L
- Show legend
3D Contour Graph
In case of contours, the graph scale settings are not the same.
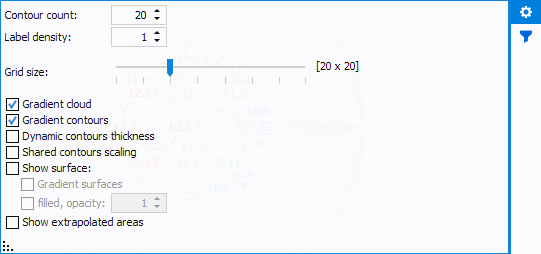
- Contour count: set the number of iso-contours to display
- Label density: set the number of label as function of the contours
numbers (e.g : if set to 1, one label per contours will be dsiplayed)
- Gradient Cloud: used to apply gradient color on markers cloud.
- Gradient Contours: used to apply gradient color on contours line.
- Dynamic contours thickness: used to apply a variable contour line thickness as function of the contour value.
- Share contours scaling: used to share the same Z scale for all Z-data displayed.
- Show surface: used to display contour surface with gradient and
opacity options.
- Show extrapolated areas: allows to display extrapolated area