Graph Filter
Depending on the measurement and the graph type, multiple settings can be applied to this menu.
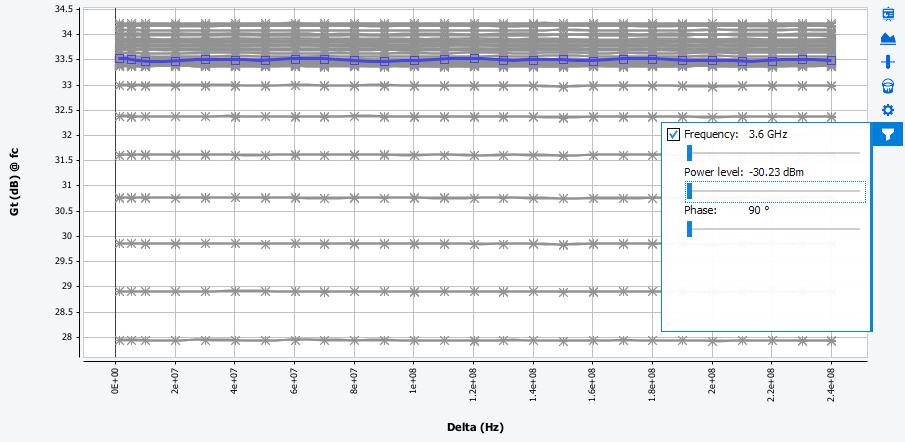
In front of each variable can be located a checkbox, if checked, the slider will be used and so one curve at the slider condition will be sent to the graph. Otherwise, no condition will be set and all curves will be sent to the next sliders or to the graph.
For the most minimal measurement (power and frequency sweep), the following is available:
In this case, the colored / highlighed frequency curve is selected from the slider.