
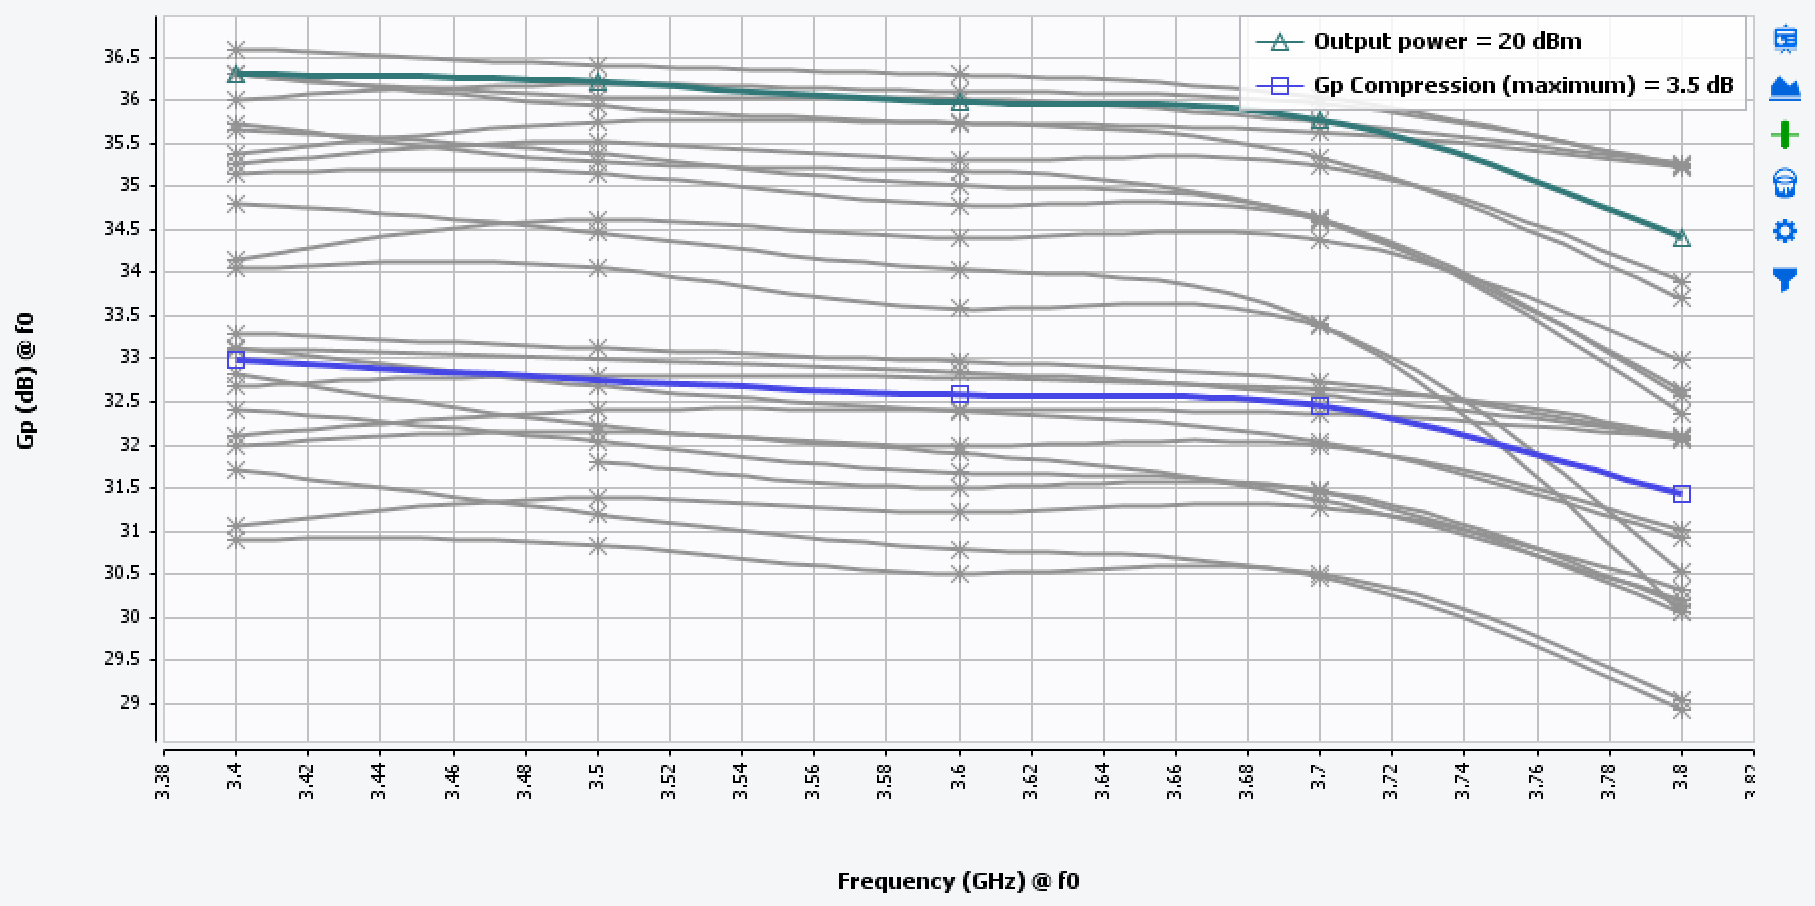
Data at Constant conditions
Click on  to
plot or list in table the data as a function of variables (Frequency, Delta frequency in
2-tones, Mag VSWR, phase VSWR) at a specified gain compression or power level (@XdB gain
compression, @YdBm output power, @PAPR compression, @MaxPAE …). Enable one or two
parameters and set the parametric data in order to display the data as a function of
frequency as example.
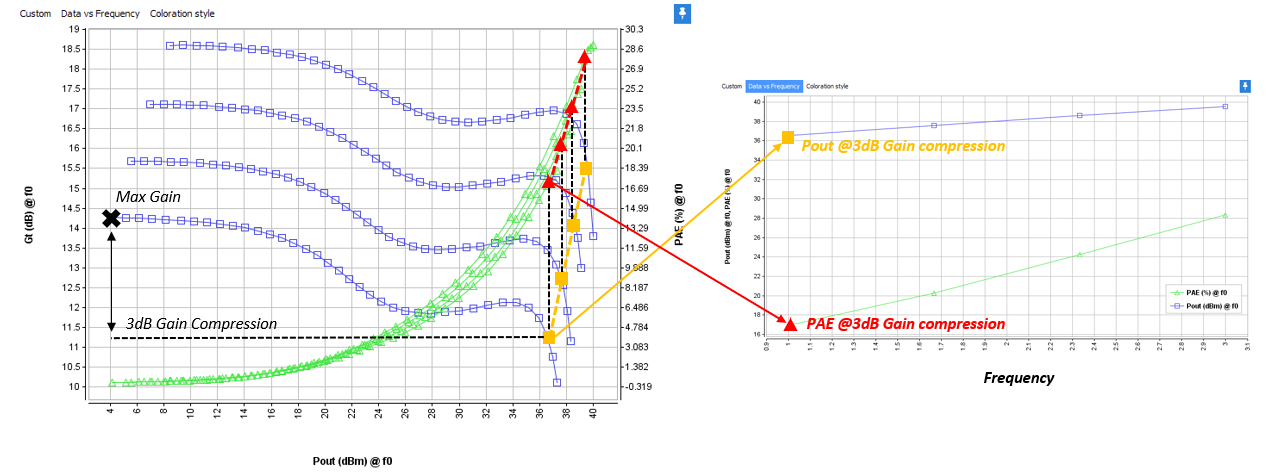
to
plot or list in table the data as a function of variables (Frequency, Delta frequency in
2-tones, Mag VSWR, phase VSWR) at a specified gain compression or power level (@XdB gain
compression, @YdBm output power, @PAPR compression, @MaxPAE …). Enable one or two
parameters and set the parametric data in order to display the data as a function of
frequency as example.
to
plot or list in table the data as a function of variables (Frequency, Delta frequency in
2-tones, Mag VSWR, phase VSWR) at a specified gain compression or power level (@XdB gain
compression, @YdBm output power, @PAPR compression, @MaxPAE …). Enable one or two
parameters and set the parametric data in order to display the data as a function of
frequency as example.- Type: select the parametric data
- Point count: select the number of point to compute the average gain compression (linear). To learn more see Gain compression
- Level: set the level of the parametric data
- Output BackOff: it is possible to add an output power back-off value from
the first level defined
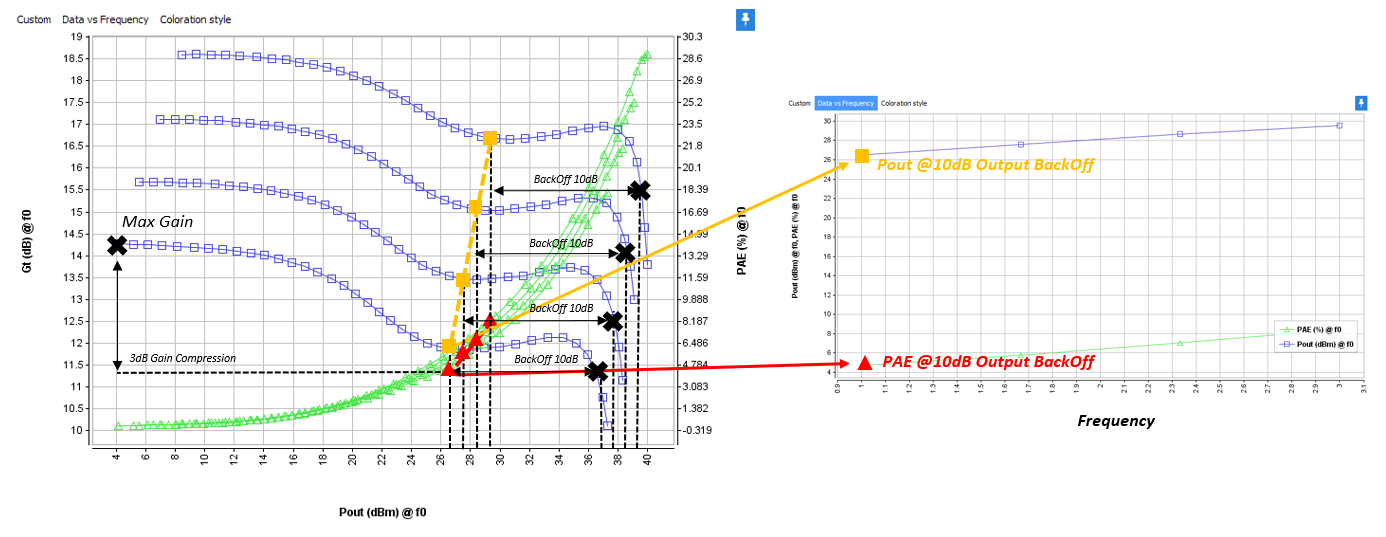
Then come back to Graph Configuration in order to set the data to plot.