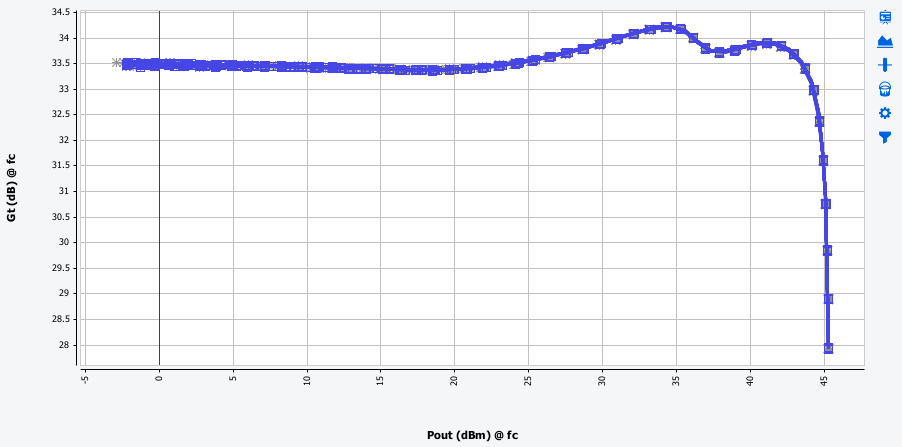
Graph Configuration
Click on ,
to configure the graph type and the data to plot or list in a table:
- Type: select the curve type in the list (X/Y graph, Y Smith Chart, Z Smith Chart,Polar. …)
- Axis: select the axis X, Y left, Y right
- Level: by default is set to fundamental frequency (fc), but it's possible to display the fc-delta frequency (lower tone) or the fc+delta frequency (upper tone).
- Data: select the data from the list
- Complex part: for complex data (ex: Zin) select the complex part to display (Real, imaginary...)
- Unit: depending on the data selected the unit list is automatically updated
With  and
and  , you can add or remove curves on
the graph. The pencil automatically set the graph to default by cleaning all the items.

