Graph Mode
Clicking on  , four graph modes can be available depending of measurement sweep configuration :
, four graph modes can be available depending of measurement sweep configuration :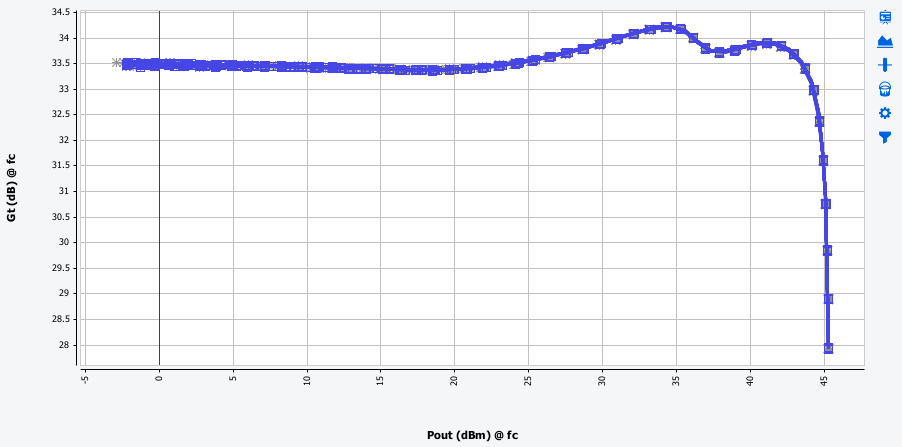
Graph 2D
Graph 2D mode allows to plot Data (Pout, PAE, Gt, …) in 2D. This graph mode is always available without any requirements.
In Graph 2D mode, following settings are available:
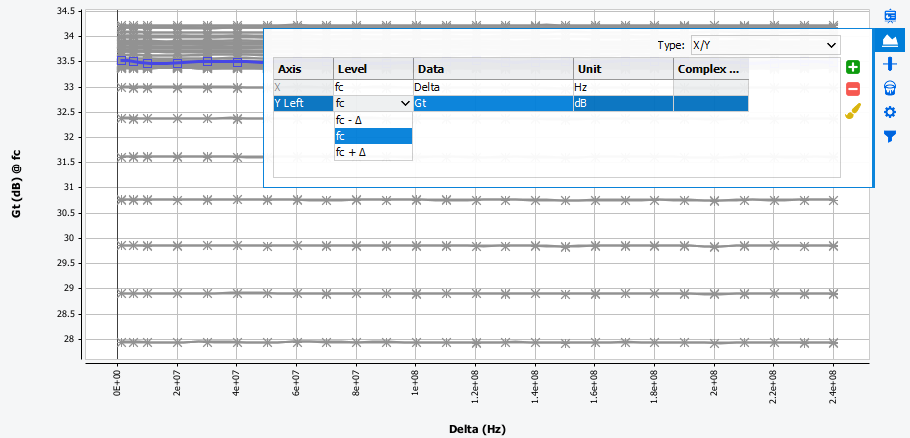
- Graph Configuration
 :
Graph Type, Data Axis settings
:
Graph Type, Data Axis settings - Data at Constant conditions
 Plot data @XdB gain compression, @YdBm output power, @Max PAE ...
 - Curve Coloration style
 :
Set coloration style.
:
Set coloration style. - Graph Scale Settings
 :
Set graph scale.
:
Set graph scale. - Graph Filter
 :
Select curve to highlight.
:
Select curve to highlight.
To learn more on available data, see Output data.
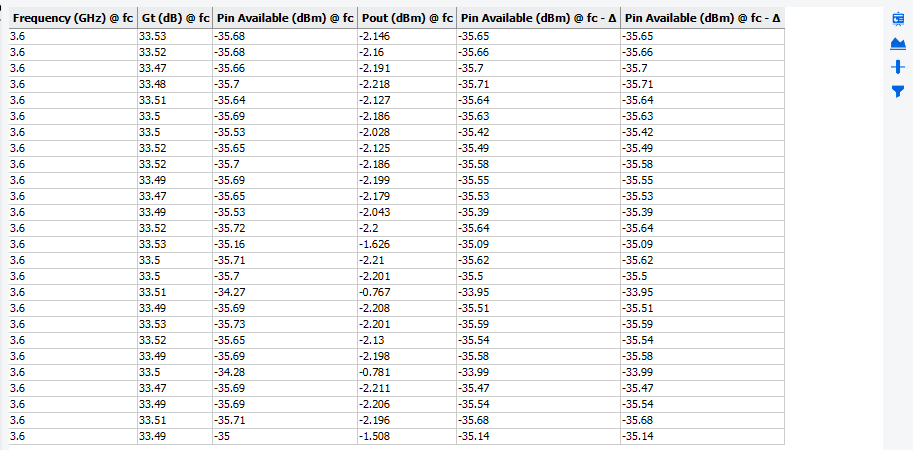
Table
Table mode allows to list Data (Pout, PAE, Gt, …) in a table. This graph mode is always available without any requirements.
In this Table mode, following settings are available:
- Graph Configuration:
Graph Type, Data Axis settings
- Data at Constant conditions
Plot data @XdB gain compression, @YdBm output power, @Max PAE ...
- Graph Filter:
Select curve to highlight.
To learn more on available data, see Output data.