S-Parameters Real-Time Measurements Display
Once the configuration of S-parameters is completed, the setup must be initialized
( ) to access
the measurement button (
) to access
the measurement button ( ).
IQSTAR uses the measurement configuration to set the instruments and run the sequence.
).
IQSTAR uses the measurement configuration to set the instruments and run the sequence.
Note: Scroll the mouse wheel in order to zoom in/out on the graph.
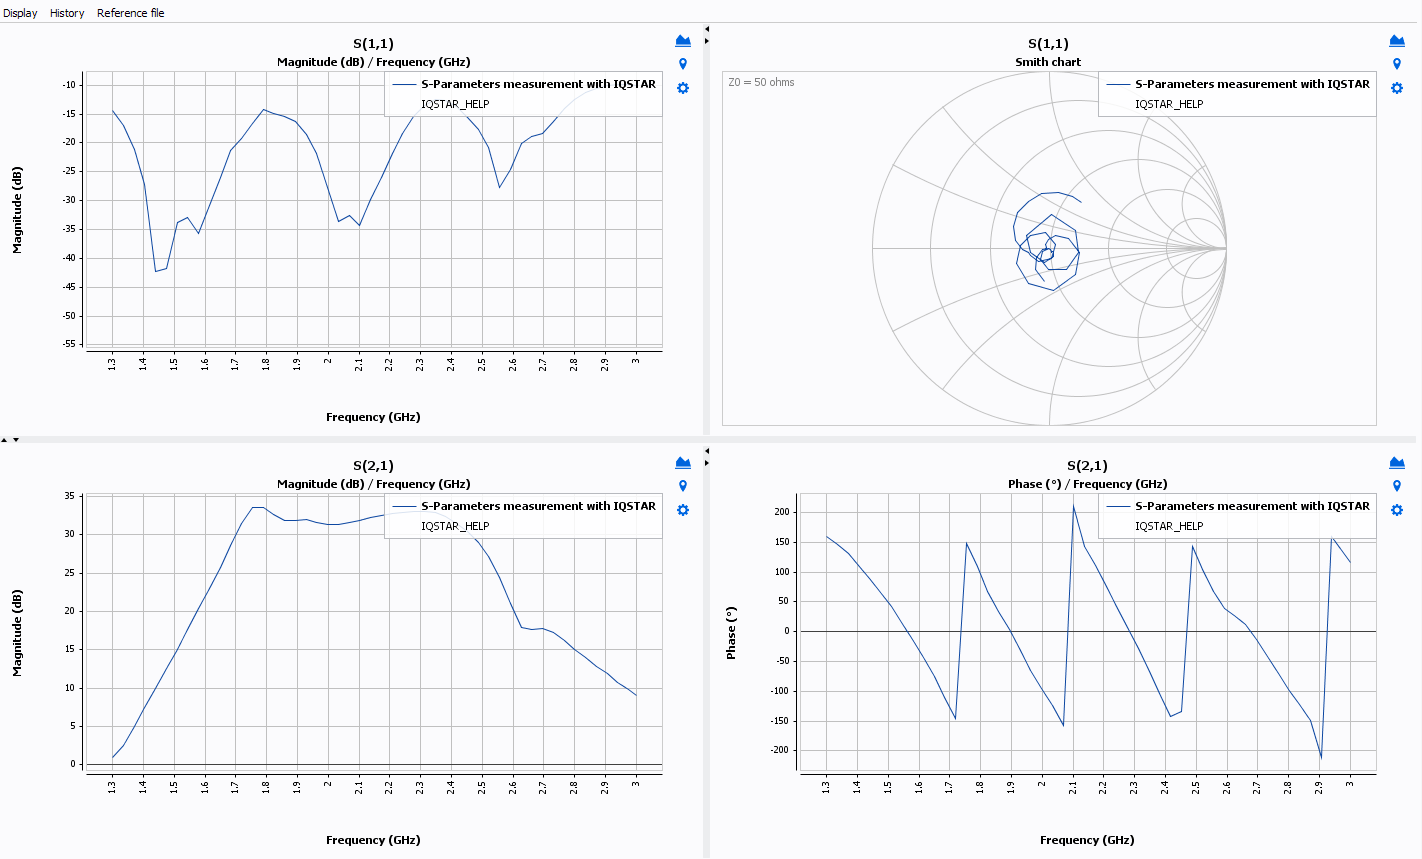
Results are displayed during the measurements. IQSTAR proposes many configurations in order to monitor the DUT characterization in real-time.
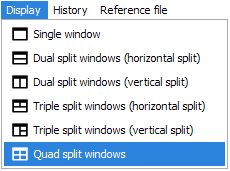
- Windows display: from top left side of the window, it's possible
to modify the graphics layout
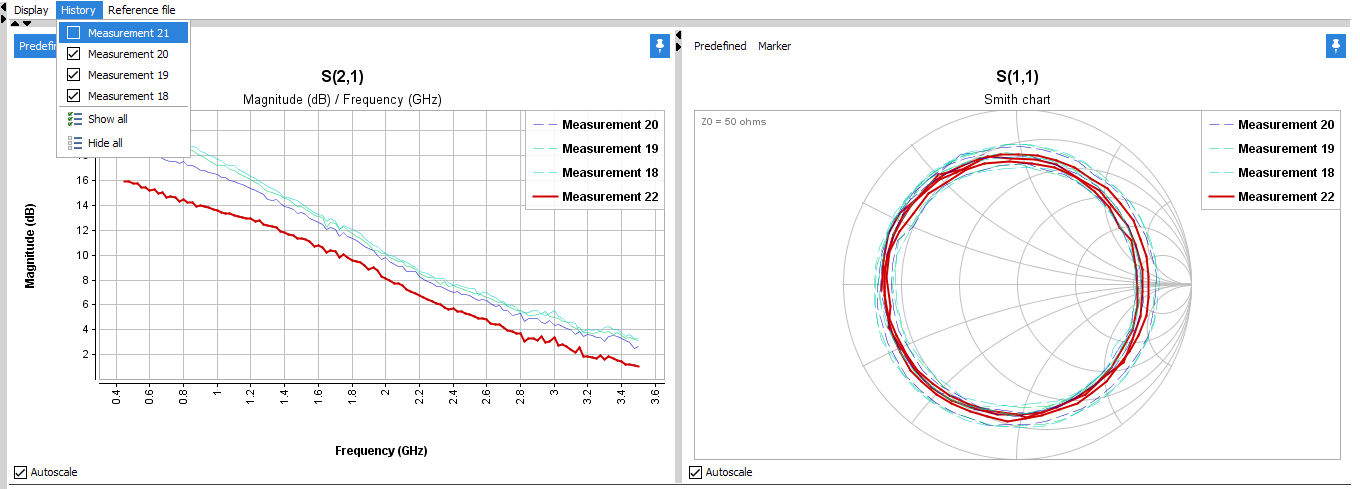
- History: during the measurements, it is also possible to display
on the real-time measurement windows previous results using the 'History' menu.
- Graph configuration: each graph can be separately configured
- Click on
 to configure the graph type and the data to plot
- Families: select the parameter type, scattering [S], admittance [Y] or impedance [Z]
- Curves: select the parameter to display and the graph type ('Magnitude (dB)/Frequency (GHz)', 'Phase (°)/Frequency (GHz)', 'Smith Chart'...)
- Data: select the data of interest
- Click on
 to add markers on the graph
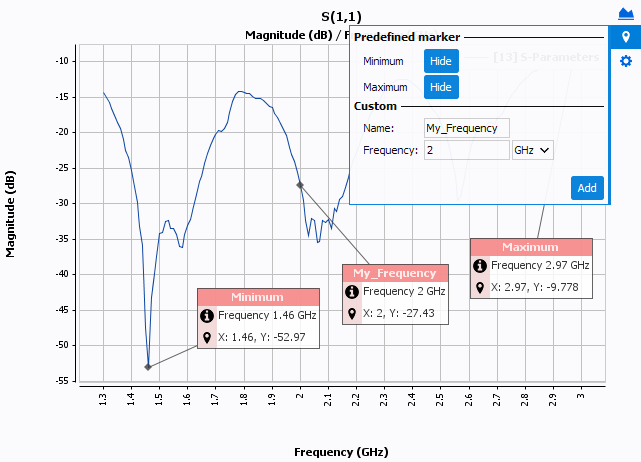
- Predefined marker: show or hide the maximum or/and minimum value of the graph
- Custom: set a label and the frequency of the custom marker
Note: To move marker tool-tip on the graph, keep the mouse wheel pressed and move the marker tool-tip anywhere on the graph.. - Click on
 to configure
graph axis and curve settings
to configure
graph axis and curve settings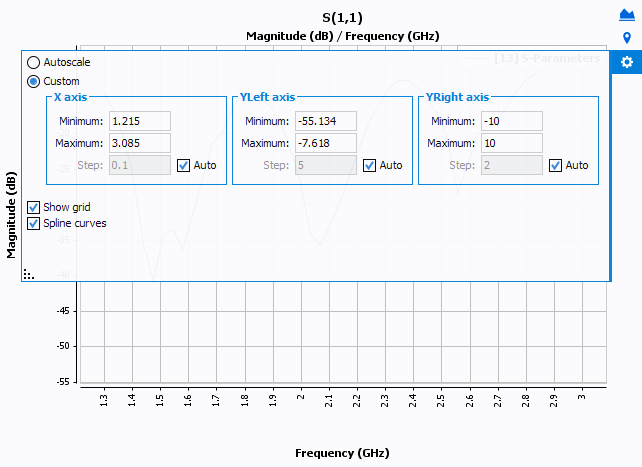
- Autoscale: If checked, the graph will automatically rescale itself when a new curve is injected. During a measurement, as points are injected periodically, the graph will rescale itself at each new point injection.
- Custom: If checked, allows to configure the axis min and max values, as well as the grid / labels step
- Show grid
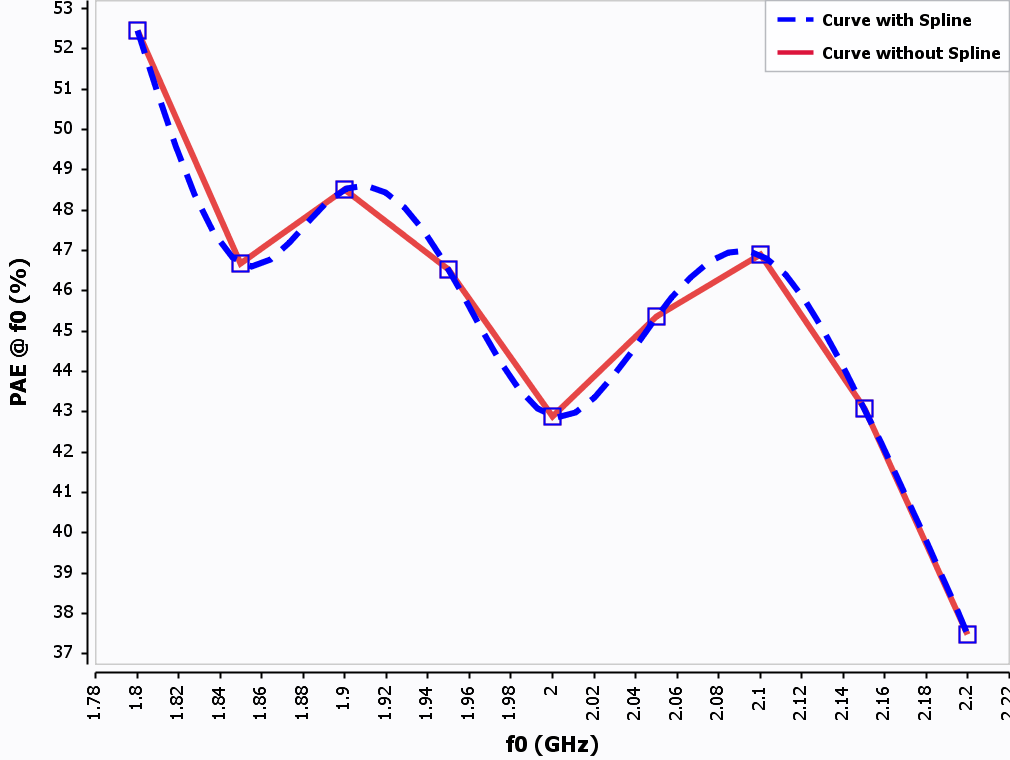
- Spline curves: Allows or not the curve fitting to be
represented as a spline. If not, simple lines are linking
points.
Note: is
used to split the screen between the graph and the configuration,
(configuration panel must be select first).
is
used to split the screen between the graph and the configuration,
(configuration panel must be select first). - Click on
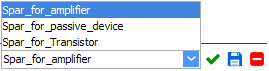
- Visualization profile: when the layout and graphs are correctly
set, save the frame in a profile at the bottom right of the window. Thanks to
the list, check, refresh, save and delete button, it's possible to manage profiles.
Profiles are also available in the S-Parameters viewer.