Why do we need Load Pull?
Load Pull is a technique to characterize RF transistors when operating in the nonlinear region, also referred to as the large signal region. Although instruments like Vector Network Analyzers measure such devices, the results are only valid in the linear operating region where such transistors are not efficient and produce very low power.
When a transistor is used with a large signal for RF Power Amplifier applications, the Load Pull is the only measurement technique that characterizes the device under test (DUT) and accurately emulates application-like conditions to predict RF specifications.
As an example, using a software-controlled Load Pull setup, it is possible to characterize a DUT, extract the optimum operating conditions and design a power amplifier in a very short time, reducing the design cycle-time and ensuring the best performances of the DUT.
Depending on the DUT Power and the thermal dissipation, load pull measurements can be carried out in CW or Pulsed CW to mitigate the thermal effects on the transistor.
Load Pull can cover a very wide range of frequency bands. The setups can be used at as low as 10MHz, and others can go as high as 1.1 THz. Therefore, it is important to identify the right load pull setup configuration that allows the best possible trade-off regarding frequency coverage, power handling, accuracy and operation simplicity.

What is Load Pull and Source Pull Measurement?
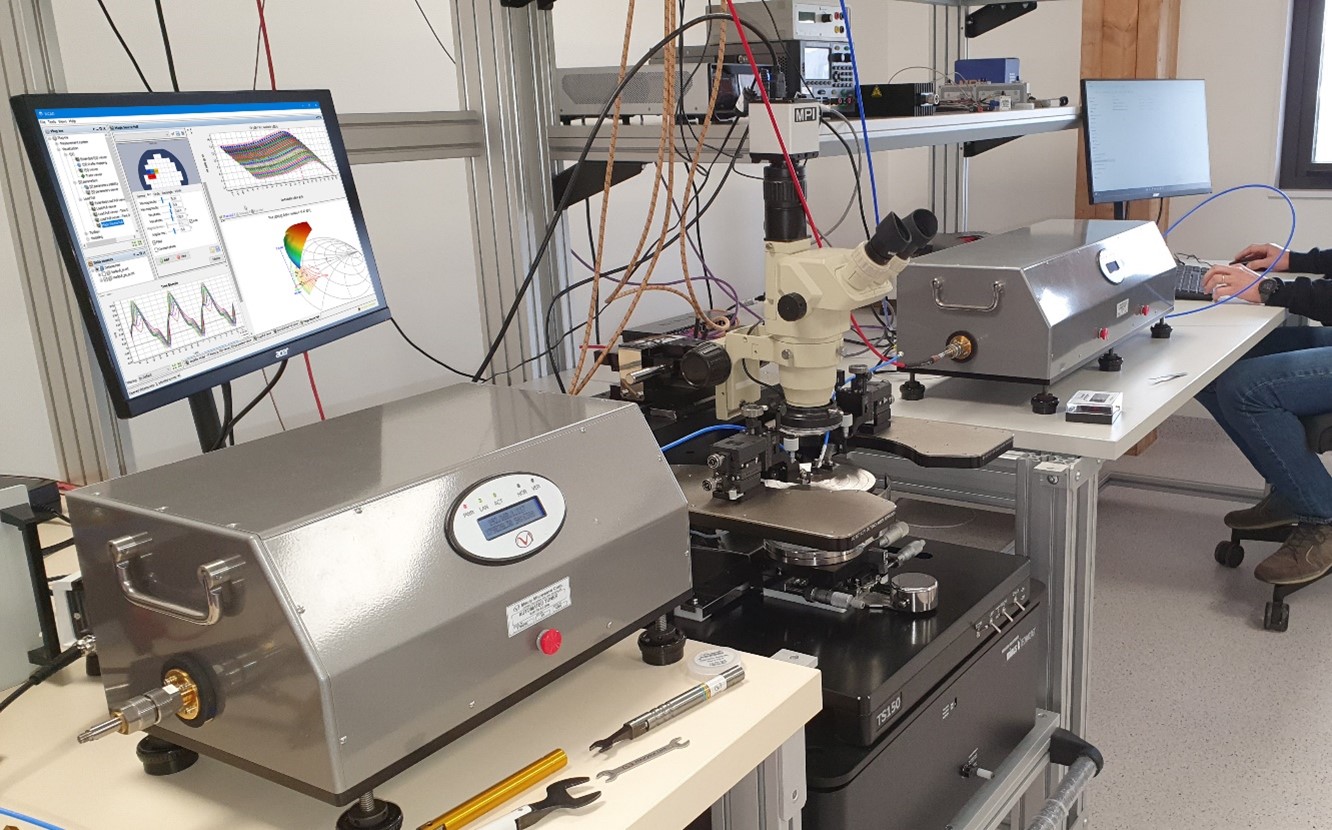
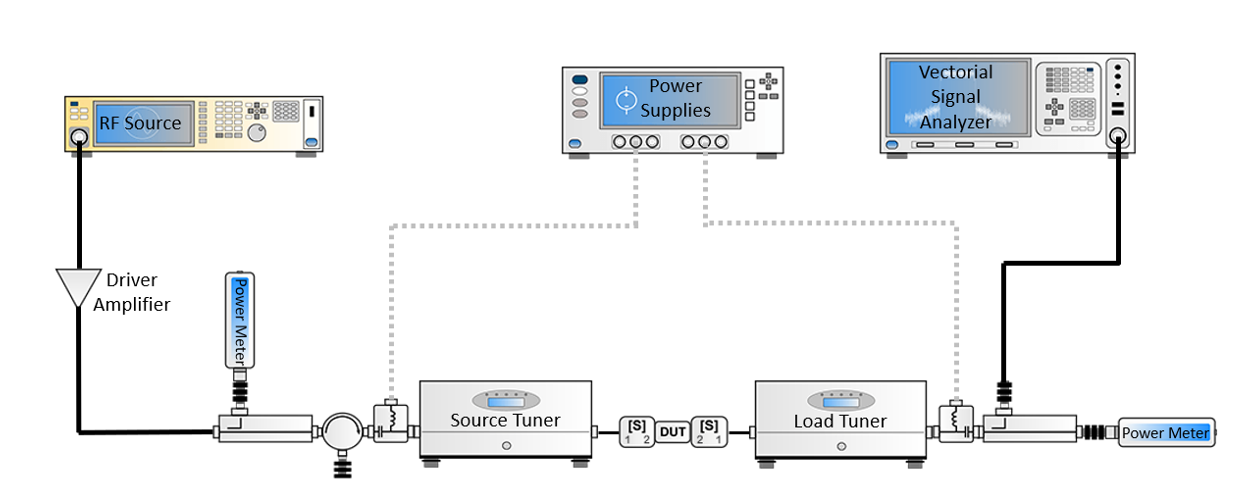
A Load Pull bench is composed of multiple instruments for stimulus, measurements and control.
The input and output impedances presented to the DUT are controlled using Load Pull tuners. When the input impedance varies, we The input and output impedances presented to the DUT are usually controlled using mechanical tuners. When the input impedance varies, we call it a Source Pull measurement. When a load impedance varies, we call it a load pull measurement. The impedance control can be done at the fundamental frequency using wideband fundamental tuners or at the fundamental and harmonic frequencies using multi-harmonic tuners.
The Load Pull measurements consist of sweeping different variables ( large signal input power, source impedance points, load impedance points, etc.) and measuring parameters to obtain the combination that exhibits the optimum operating conditions like Output Power, Output Current, Voltages….
The Scalar load pull is also referred to as the “Traditional Load Pull” in IVCAD Software Suite. Different software modules allow setup, calibrating, and control of such measurement bench for transistors power characterization as described hereafter.
Scalar Load Pull Setup
Traditional Load Pull, or Scalar Load Pull, was the first system to measure device performances automatically under various source and load impedances. The scalar setup can use coaxial or waveguide tuners. These test benches use pre-characterized passive tuners for impedance matching and scalar power detectors for measurements. Based on the pre-characterization of the impedance tuners, the measurements rely on the set of measured or interpolated s-parameters at different impedance conditions. Raw measurements from scalar instruments (power meters) are de-embedded, in real-time, to the DUT reference plane using the loss calculation of tuners and other components in the setup.
The accuracy of the measurements relies entirely on the calibration quality and the tuners’ mechanical repeatability. Therefore, building a mechanical tuner requires a high level of expertise. Maury Microwave is a company which provides state-of-the-art solutions in this domain.
The scalar load-pull architecture is cost-effective and can be advantageously driven using the IVCAD MT930D1 software module.
Harmonic and Spectrum Measurements
The Harmonic and Spectrum bench architecture adds to the fundamental frequency test capabilities. It enables harmonic load pull and wideband modulated signal measurements. A spectrum analyzer (or multiplexer with several power sensors) can be added to read specific power at each frequency and power at intermodulation frequencies if driven by a two-tone signal. Depending on the signal source and analyzer, CW, pulsed-CW, single tone, two-tone and modulated signals and their respective measurement parameters can be achieved thanks to the IVCAD MT930D2 add-on, which comes on top of the MT930D1 module
Vector Receiver Load Pull Setup
Semiconductor markets are becoming more and more competitive. Foundries require much higher measurement accuracy to gain a few tenths of a dB in power or a few percent in the device efficiency to stand out from their competition. With the advent of new Vector Network Analyzer technologies, device characterization benches shifted to Vector Receiver Load Pull (VRLP) for a much more complete characterization technique. It allows extracting parameters not possible to measure with a Scalar Setup. Therefore, most of the load pull setups built nowadays are Vector based.
VRLP-based setups also enable the possibility to use different tuning capabilities:
- Passive load pull is a technique using passive impedance tuners to synthesize a desired reflection coefficient at the DUT reference plane. As the passive tuner has inherent losses, the maximum reflection coefficient can be limited depending on the DUT connection and frequency of operation.
Different modules to help characterize transistors using VRLP:
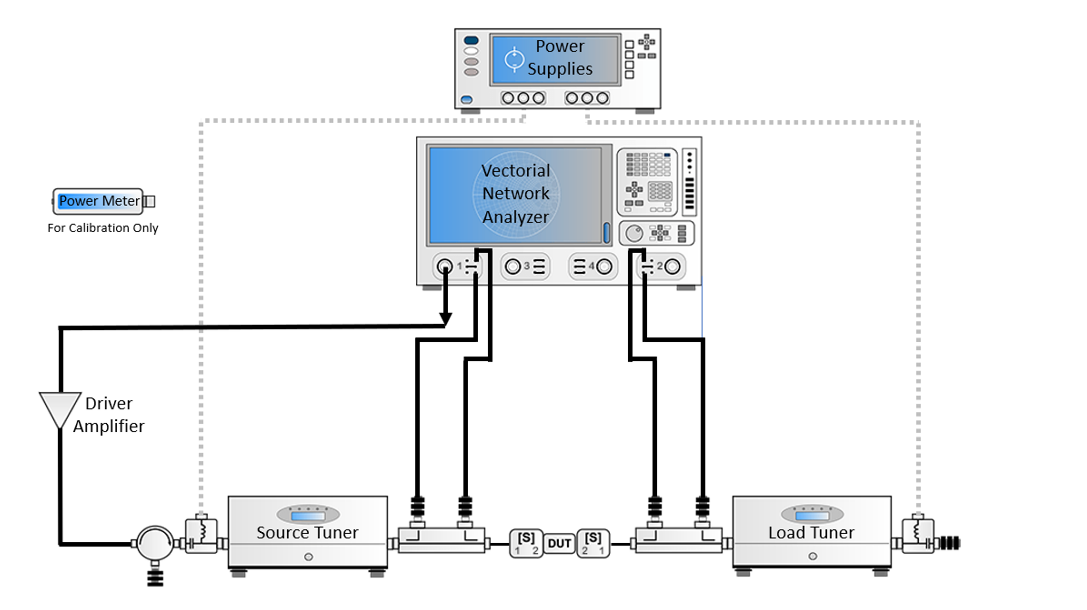
The IVCAD MT930C module offers a modern and efficient methodology for load-pull measurements. Low-loss couplers, inserted between the tuners and DUT, are connected to a VNA to allow real-time measurement of a and b-waves at the DUT reference plane, enabling vector information not normally made available with traditional setups.
This setup architecture measures the load impedance presented to the DUT without prior assumptions of tuner characterization, positioning, or losses. Extremely accurate transistor input impedance derived from the a-and b-waves results in properly defined delivered input power, power added efficiency, and power gain measurements. At fundamental and harmonics, Output powers are made available along with multi-tone carrier and intermodulation products.
Assets of Source Pull for NVNA based load-pull measurements (ARFTG 2012)
Active Load Pull Tuning
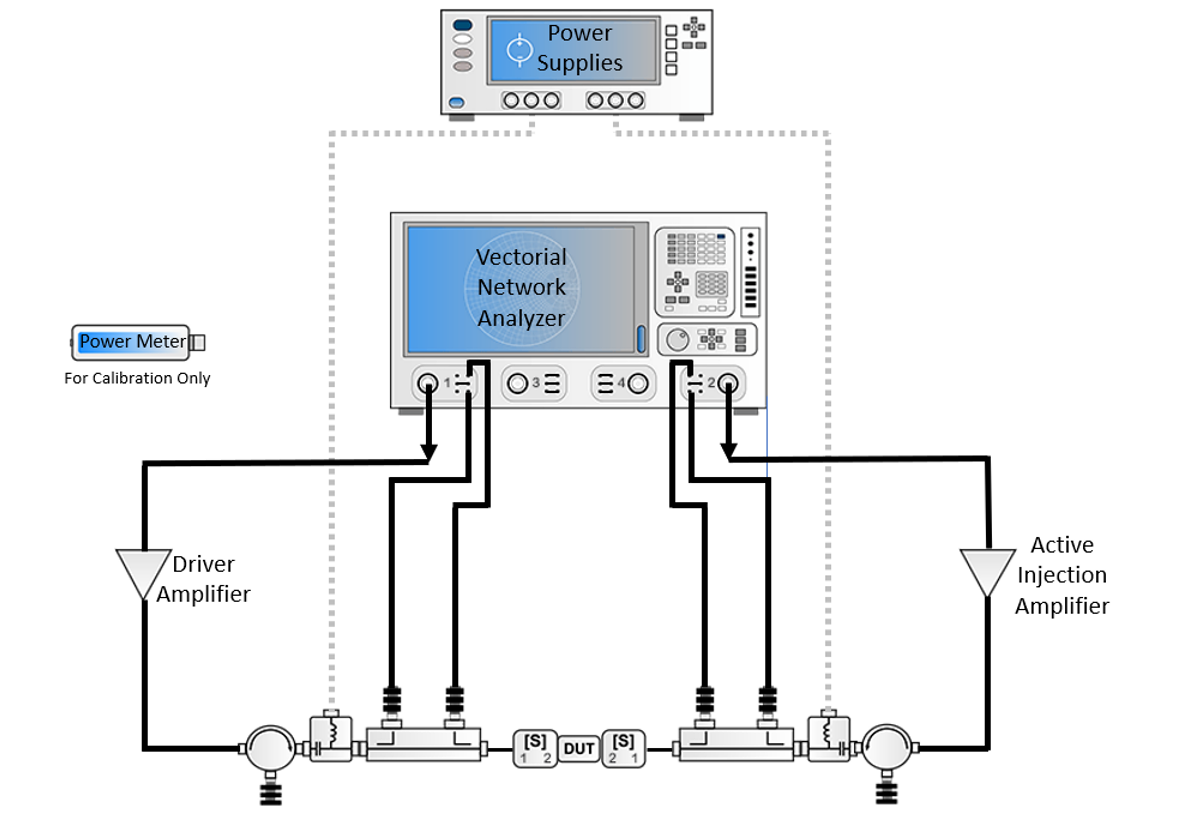
Active Load Pull is a technique using active power injection to synthesize a reflection coefficient at the DUT reference plane. The power injection can be supplied using signal generators and power amplifiers. Therefore, there is no theoretical limit to the gamma as it can be higher than 1. However, high-power amplifiers can be challenging at some frequencies when DUT requires that.
Active Load Pull module allows control of the reflection coefficient at the load side (ΓL) as the ratio between the reflected- and forward-traveling waves at the output of the DUT. A generalized form of the formula can be written as ΓL = (a2/b2). The wave b2 is taken as the wave coming from the device, while a2 is the reflected wave seen by the device under test, coming either from a passive circuit, an active circuit or a combination of both for hybrid load pull.
Active injection load pull relies on external sources (with phase and amplitude control enabled) to inject a signal toward the DUT, thereby creating the appropriate a2. Because a2 is no longer limited to a fraction of the original reflected signal, external amplifiers may be used to increase the amplitude of a2 so that ΓL can even achieve unity. Unlike harmonic passive tuners, perfect isolation can be achieved between fundamental and harmonic load tuning, which is important when the load at the fundamental frequency mainly drives performances. Finally, IVCAD algorithms enable a great tuning convergence and measurement speed thanks to the IVCAD MT930H add-on module plugged into the MT930C core application Learn More on Active & Hybrid Load Pull.
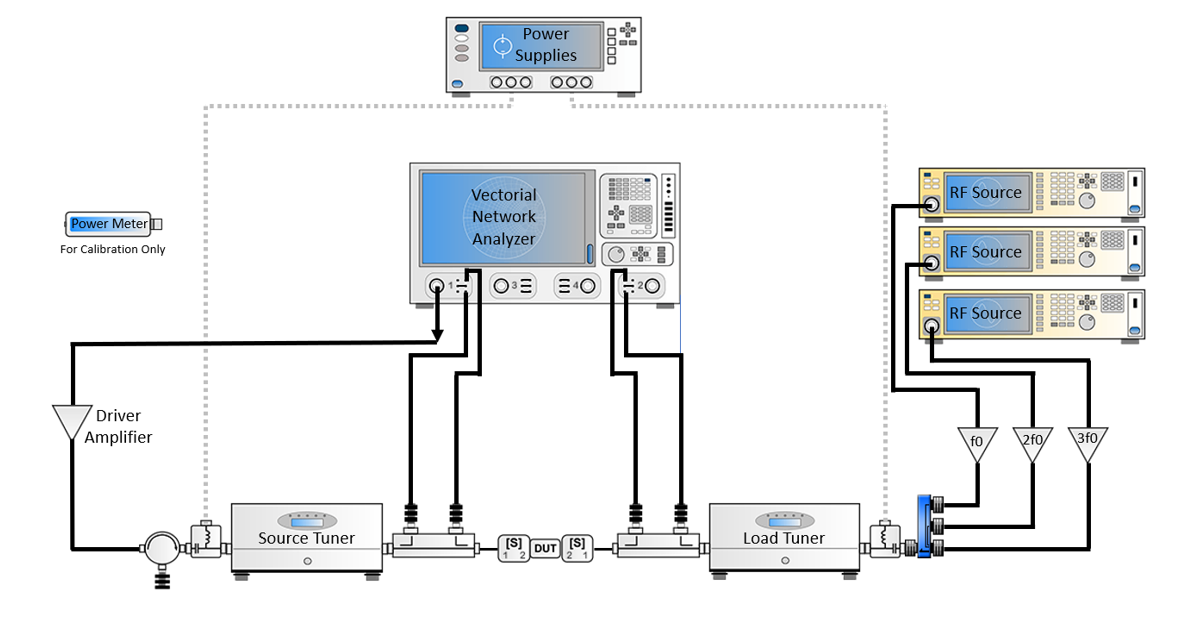
Hybrid Passive & Active Load Pull
Hybrid Active Load Pull is a technique using both passive tuners and active injection. This method is used to mitigate the need for a high-power amplifier for the active injection by pre-matching the device using the passive tuner. This technique is a good compromise when high gamma is needed at the DUT reference plane, but the active injected power is limited.
In addition, the combination of reflected signals sent by the passive tuner and the active RF sources can be set for either fundamental or harmonic frequencies. This technique is often used to upgrade a load pull to control load impedances at fundamental frequencies only to a harmonic load control solution.
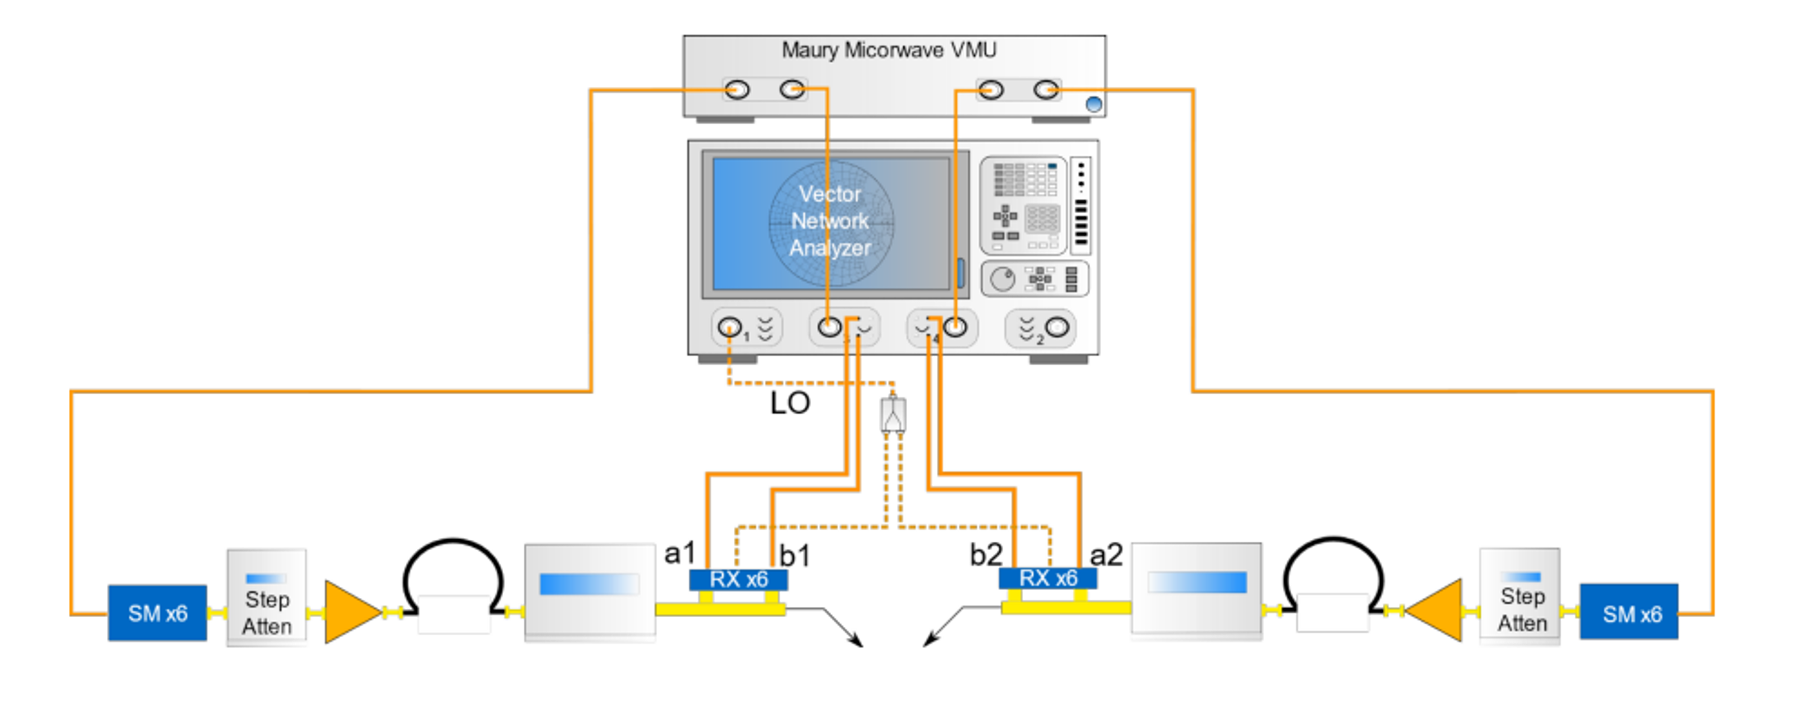
Waveguide Vector Receiver Load Pull
Until now, load pull at frequencies higher than 67 GHz was limited to scalar benches due to the waveguide setup and the impossibility of measuring at the VNA receivers directly at the frequency of interest. When characterizing a transistor at high frequencies, the losses between the tuner and the DUT reduce the tuning range of the system drastically. As a rule of thumb, the higher the frequency is, the lower the maximum achievable gamma is. Maury Microwave developed dedicated low-loss couplers with an integrated down-conversion circuit that allows direct measurements of a- and b-waves using the VRLP concept.
Combining the appropriate hardware and the software module MT930C1, one can take full advantage of the VRLP using the waveguide setup.
Hybrid-Active Waveguide Load Pull
Input and output amplitude and phase control module before up-conversion (block B) allow high-resolution control of injected active tuning signals. Maury Microwave has developed this module to empower waveguide passive and hybrid active load pull. With such a system, a waveguide load pull bench can achieve very high gamma at the DUT reference plane and enable the characterization of highly mismatched devices in these frequencies with good accuracy.
Load Pull Analysis Through Time-Domain Measurements
The IVCAD MT930GA Large Signal Analysis (LSA) option is an add-on module for MT930C Vector-Receiver Load Pull (VRLP), enabling time-domain large signal analysis and waveform reconstruction. It does require a comb generator such as the HPR727A Harmonic Phase Reference. This module generates a comb of phase calibrated harmonic frequencies used as a phase reference.
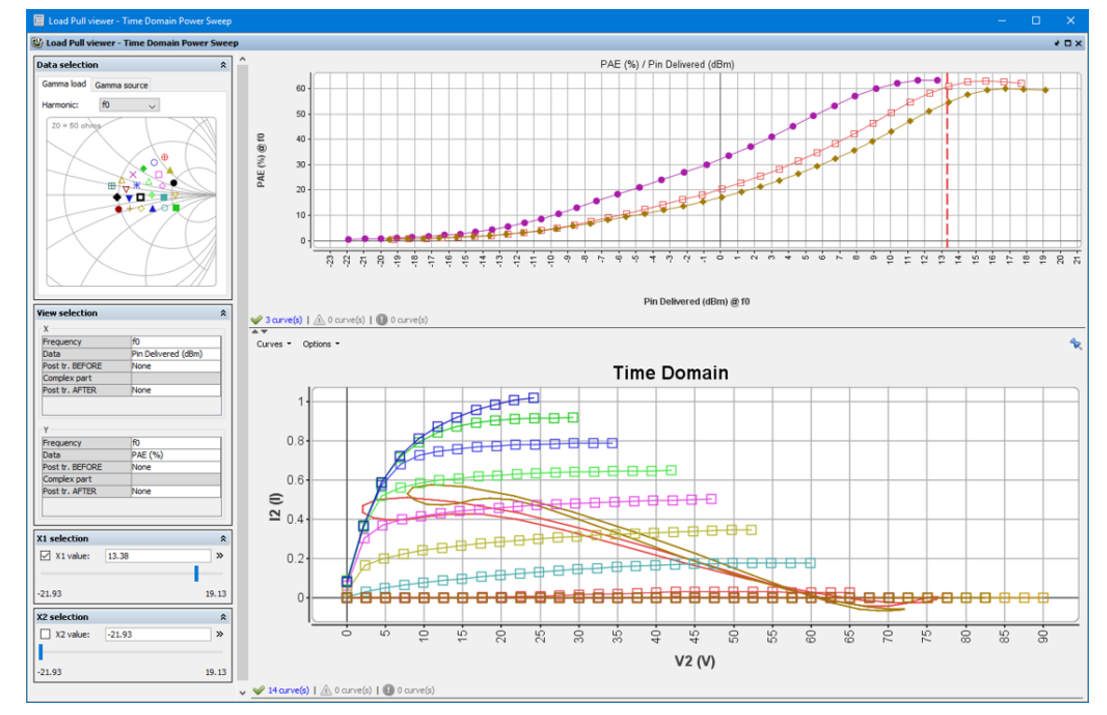
Once calibrated, and because of the extensive knowledge of the absolute magnitude and phase signals at the DUT reference plane in the frequency domain, an inverse Fourier transform can recombine the a and b waves to reproduce the original RF signal in the time domain.
Consequently, the LSA add-on can also be used to enable voltage and current waveforms plotting and dynamic load lines display for each measurement state (impedance/power/bias). All measurements are de-embedded to the device reference plane.
How to Visualize Load Pull Contours?
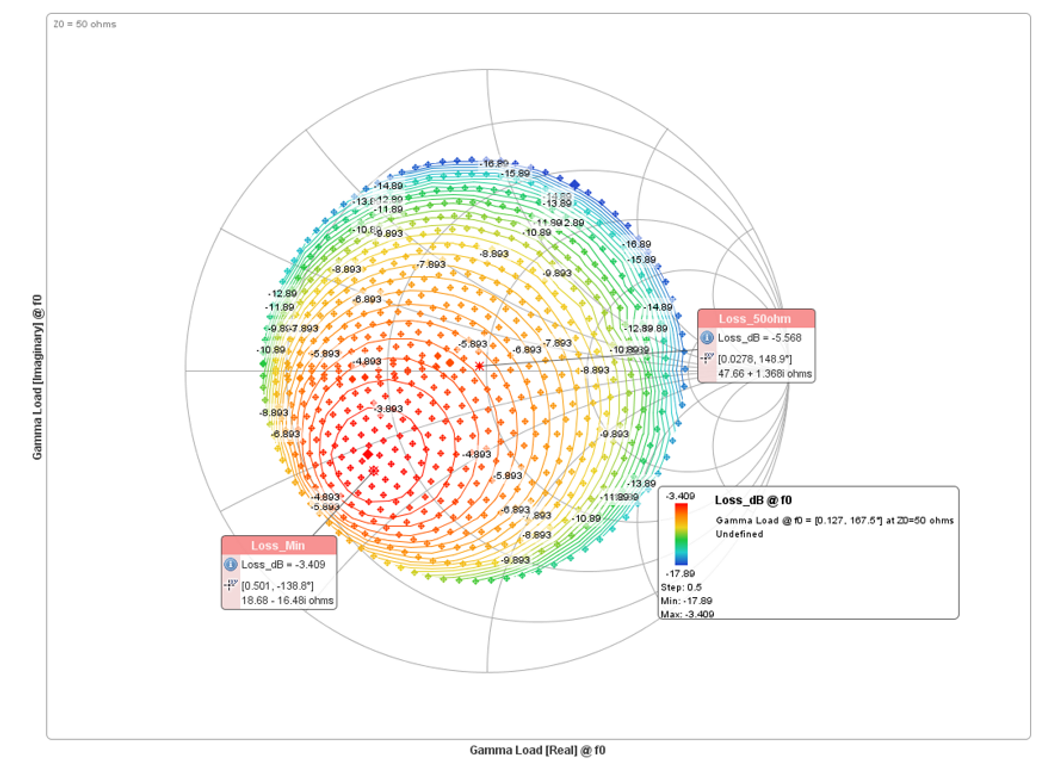
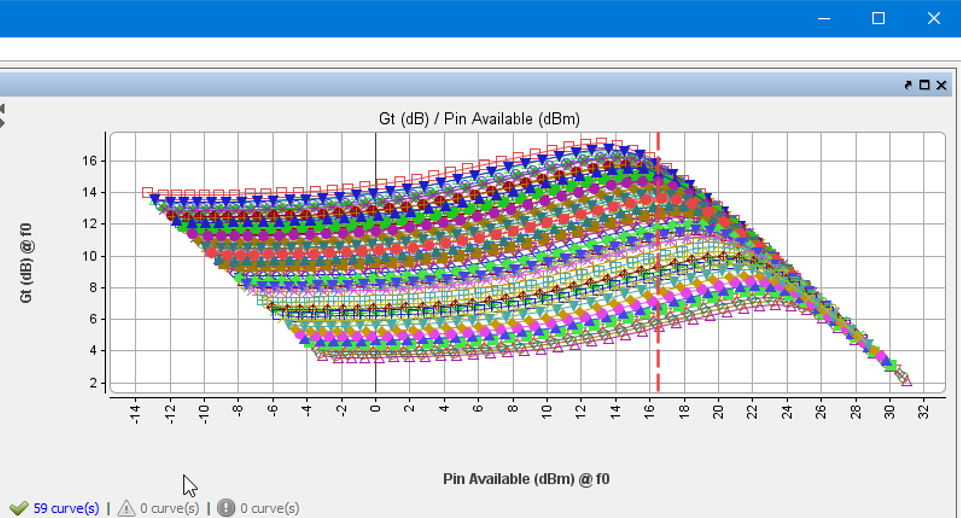
Using a circuit simulator to visualize load pull measurement data may be overkill if the aim is to determine the Maximum Efficiency (MXE) or Maximum output Power (MXP) impedance. Consequently, specific visualization tools have been developed to interpolate the test results to plot iso power or iso gain curves on the Smith chart. In addition, it is necessary to plot impedance sweeps and power curves, so the device behavior in nonlinear conditions can be analyzed through filtering tools and data management capabilities.
Hence, an intuitive visualization package can help understand the device behavior in linear and nonlinear conditions to display IV, S-Parameters, and load pull data. Built for this purpose, the IVCAD MT930B1 module offers the following functionalities :
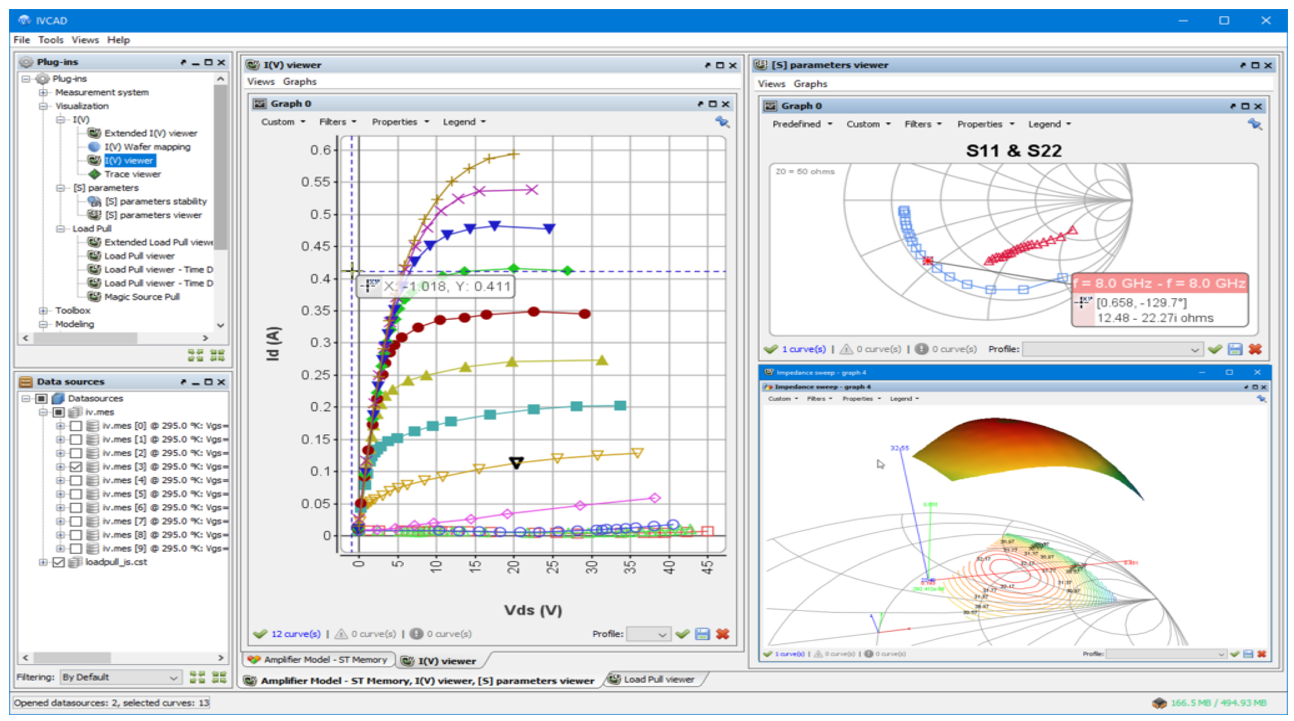
- I(V) Viewer plots basic IV curves of Vd, Vg, Id, and Ig to understand how the device under test operates.
- On top of the IV curves, It is useful to add S Parameter Visualization capabilities to plots S-parameters in standard and custom formats, including log magnitude, linear magnitude, phase, polar, Smith Chart and more.
- Load Pull Viewer completes the solution to plot impedance sweeps and power sweeps, so the device behavior in nonlinear conditions can be analyzed through filtering tools and data management capabilities
Ideally, Dockable windows allow users to create and save custom environments. Templates can be used to save their preferred visualization graphs and recall or share them with colleagues. A Data Editor allows the creation of new parameters based on equations and visualizing them alongside measurement data.
Finally, Export capabilities allow saving graphs and exporting them as JPG, PNG or PDF files for reporting. Visualization modules are compatible with common commercial data formats. IVCAD MT930B1 solution has been designed to address these different needs.
More Advanced Visualization Needs
Sometimes real-time post-processing of the raw measured data has to be applied. For example, one may want to observe how the MXE and MXP impedances vary with the gain compression level or see the optimal impedance trajectory at 3dBc as a function of frequency. It may also be necessary to ensure that the used impedances will not cause parasitic oscillations.
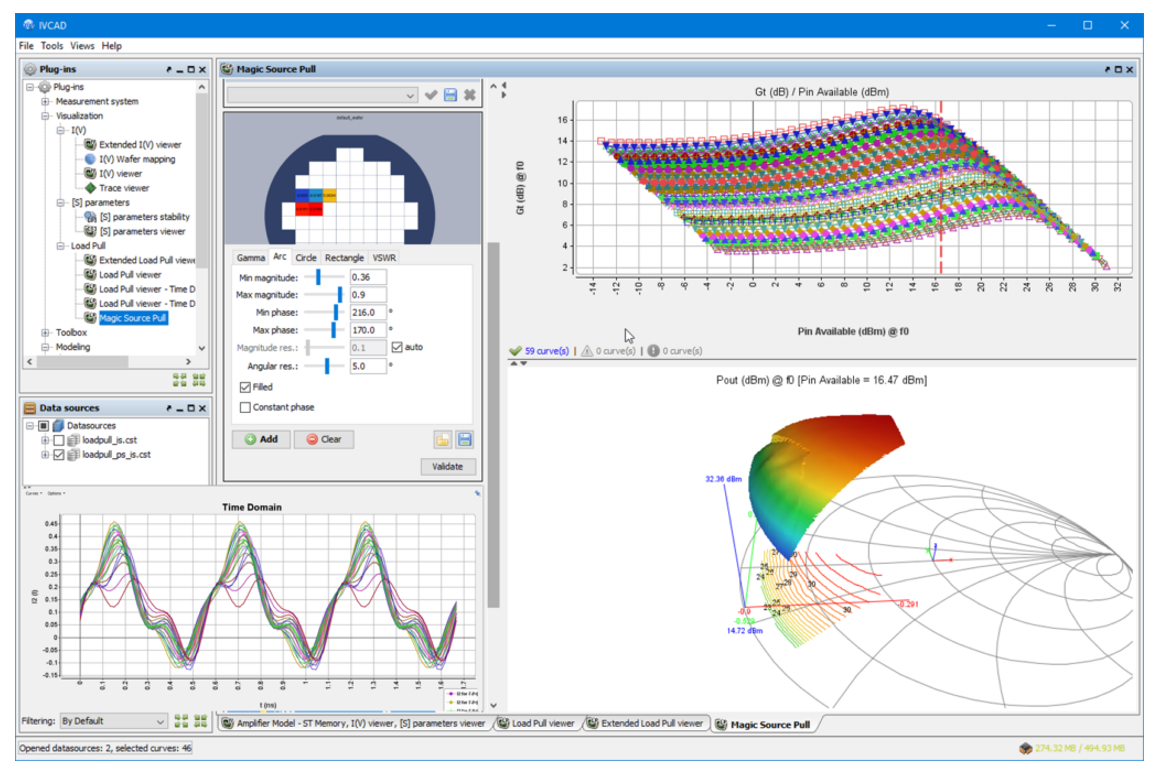
- Even before load-pull measurements, Advanced S Parameter Viewer allows plotting stability circles, operating and Maximum Gain circles as a function of frequency or bias parameters to help the load-pull users optimize their load impedance pattern before running the measurements.
- Once the tests are finished, an Extended Load Pull Viewer can be needed to plot interpolated load-pull contours versus power levels or gain compression. Time-domain load-pull waveforms can be an add-on to observe the RF load lines superimposed on the IV curves as a function of the power level.
- It could also be required to dynamically emulate the equivalent source pull measurements, such as the transistor’s transducer gain versus source impedance for any load impedance.
IVCAD MT930B2 add-on can then be used to satisfy these kinds of requests.
Customized visualization tools
There is usually no solution that can cover all the different needs to leverage all these data to design power amplifiers better.
According to the performance obtained, some load-pull experts want to select a set of load impedances and then exploit this information to facilitate matching circuit design through advanced post-processing tools.
It may then be required to start from scratch, using a blank page such as on the whiteboard, and design a fully customized visualization environment based on the company’s internal processes.
As shown in the opposite, based on the measured load-pull contours, one may want to select a few impedances, visualize the corresponding curves, and then apply some post-processing to extend the prediction of the power amplifier performances for various frequencies for some interpolated load impedances provided by different matching circuits, over different gain compression levels.
This visualization environment will then call different customized scripts, different functions, and specific equations to facilitate the job of the PA designers even before any simulation works. See our Whiteboard description for further information.
What about Load Pull Simulation?
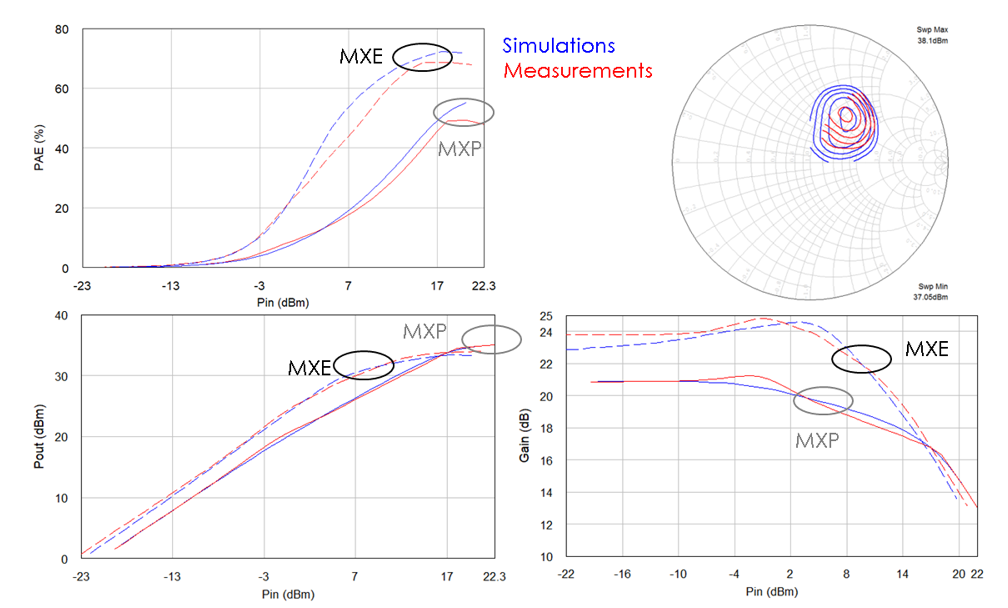
The load pull contours are the source of information to identify the optimum impedance point for a maximum output power provided by DUT, usually referred to as MXP or the optimum impedance point for a maximum output efficiency, referred to as MXE. The power amplifier designer may identify the impedance that exhibits the best compromise between Power and Efficiency from this data. The work is run through a Harmonic Balance simulation, using a transistor model which can be used for linear and nonlinear optimizations depending on the design goals.
The Load Pull iso-contours are important to power amplifier designers. They can design input and output matching circuits using commercial circuit simulation software like Keysight ADS or AWR/Cadence MWO to synthesize the desired impedance based on the load pull measurement results. Different tutorials on load pull simulation and load pull data analysis using different templates are available on CAD tool suppliers’ websites to help transition easily from the measurements to the simulation.
Load Pull Measurement Data Leveraged in the Form of Behavioral Models
Even if the designer does not have a compact transistor model, it is often required to go beyond load-pull data post-processing work. The test file contains important information about the transistor response to multiple stimulus levels and impedance matching at the load and the source. This data can eventually be used to generate a behavioral model of unmatched transistors to enable a complex PA design, such as Doherty amplifiers, using components on the shelf (COTS) transistors. Behavioral models are useful for running load pull simulations and predicting the overall power amplifier characteristics at various frequencies and conditions.
For this purpose, AMCAD Engineering has developed a state-of-the-art Enhanced Poly-Harmonic Distortion (EPHD) modeling solution. The IVCAD MT930GA module can be combined with MT930R1 to extract such a model with no extra time easily.
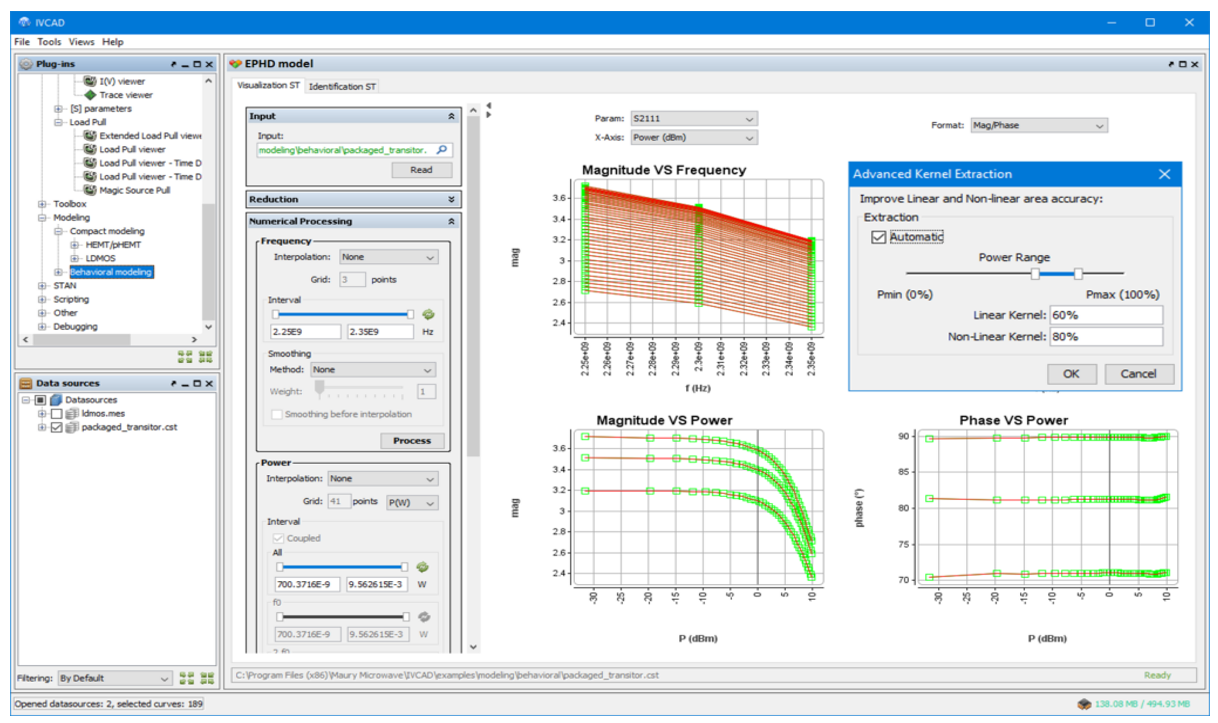
When the project timeline and budget are limited, to the contrary of compact models, the EPHD model becomes a serious candidate because it allows extracting a model on the fly from load-pull measurements and saves considerable design time. The ability of this model to predict the overall design performances without any convergence issues for harmonic balance simulations has been proved even for extrapolated load conditions during the simulation and with the load impedances used during the load-pull measurement process. Therefore, this new model is a promising solution for designing power amplifiers for future telecommunication systems due to its robustness, flexibility, and reliability under ROI constraints.
AN: Behavioral Model of High Power GaN HEMTs for RF Doherty Amplifier
The extraction of the EPHD model requires the amplitude and phase information of the a- and b-wave at the fundamental and harmonic frequencies. Such measurements are only possible when a harmonic phase reference is used with the VRLP setup.
Load pull and Modeling can also be Useful to Simulate Power Amplifier Response
A behavioral model of a power amplifier can be required to simulate the impact of load impedances on the circuit’s performance. For example, an isolator plugged into the output of the PA can modify its performance. If the isolator is not perfectly matched on 50 Ohms at fundamental and harmonic frequencies, it may impact the output power of PAE characteristics.
The EPHD model can simulate the PA when this one is loaded with a different S-parameter bloc file representative of the isolator characteristic. Thus, different isolators provided by different vendors can be tested in a virtual simulation environment to make the best choice and optimize the design.
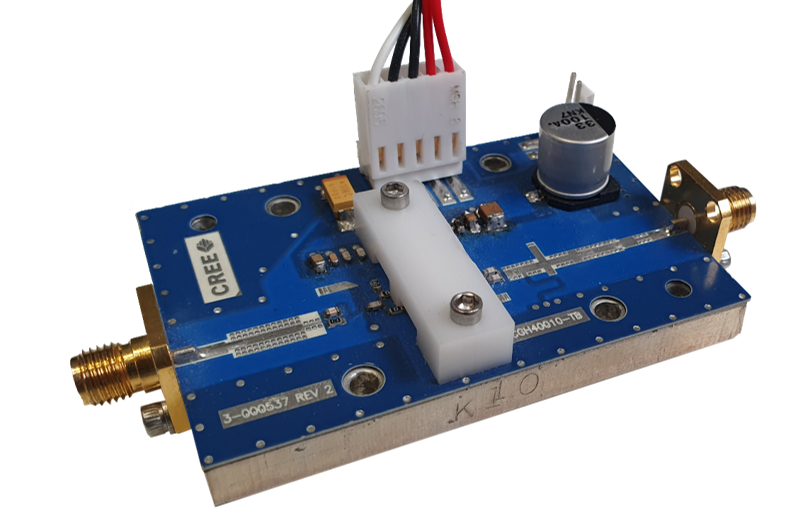
For instance, it may be required to simulate the effect of the load pull termination on a demonstration amplifier circuit, such as the 10W RF Power Gan HEMT amplifier provided by Cree Wolfspeed.
To extract such a model, it is necessary to upgrade the setup with absolute phase calibration capabilities between the fundamental and the harmonic tones. The model can then be extracted on the fly and used for harmonic balance load pull simulations.
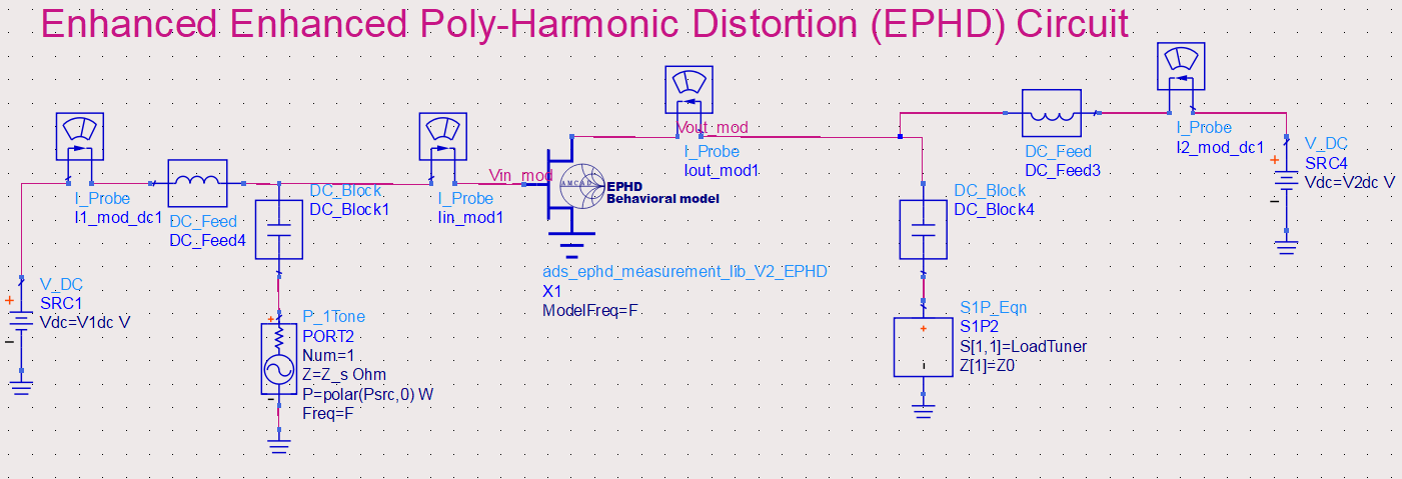
EPHD Simulation template in ADS (Keysight Technologies) 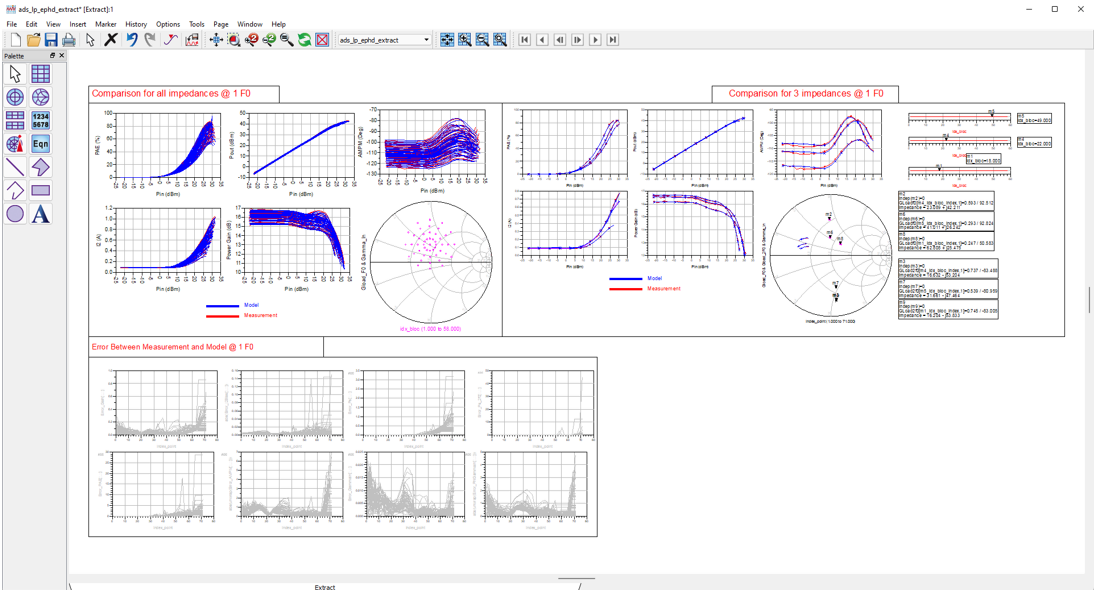
Load Pull simulation template using an EPHD model extracted from load pull measurements
The EPHD solution is a turnkey black-box modeling tool based on load-pull measurements that overcome the challenge of quickly extracting packaged or on-wafer device models.
This 10W GaN Device model example can be downloaded for free to evaluate its capabilities at 3.7GHz (contact us).
Note: This model is memoryless. Consequently, it is not recommended to use this one for transient or data flow simulations when modulated signals are used. For such an application, please refer to the models offered by our Vision modeling and simulation tools.
Conclusion
Performing load pull measurements to better design RF circuits is an exciting activity. Some of us would say it’s an art!
Different techniques and methodologies can be tested to use each milliwatt provided by the components under test efficiently.
This problem is all the more important today, as it is a major challenge for all designers of radio communication systems to reduce their power consumption. To its full extent, load pull tests make it possible to optimize the linearity and efficiency of RF communication systems, such as those used for 5G.
These tests, therefore, contribute to making these systems less energy-consuming, which indirectly contributes to preserving our climate and our planet.