
Modulation Measurement Panel: Receiver Settings
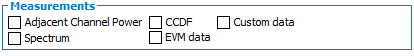
This tab allows defining the measurements done by the Vector Signal Analyzer. Six (6) types of analysis can be done, depending of the instrument used (refer to Supported Vector Signal Analyzers):
Adjacent Channel Power Ratio (ACPR)
 to add one or multiple lines
in the Carrier Settings (Main channels = Reference channels) or Offset Settings
(Adjacent or Alternate channels).
to add one or multiple lines
in the Carrier Settings (Main channels = Reference channels) or Offset Settings
(Adjacent or Alternate channels).
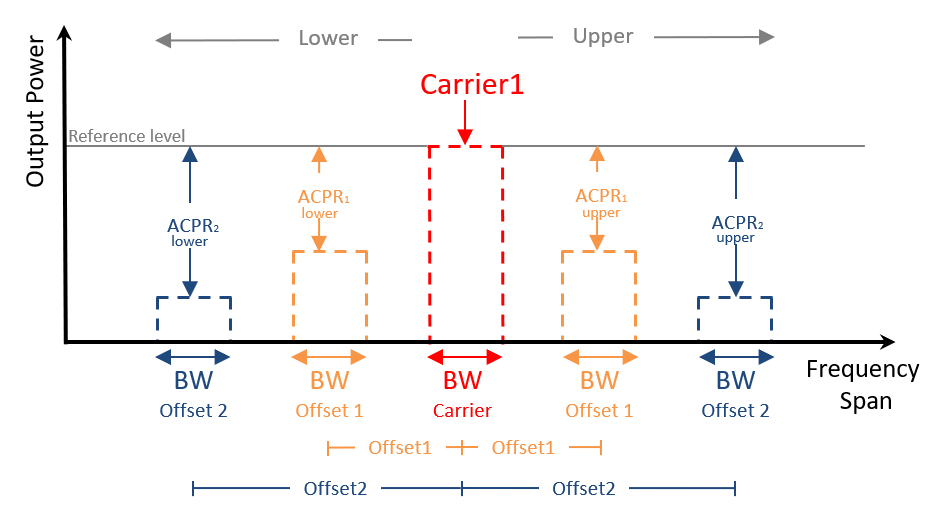
It's also possible to define other parameters such as:
- Resolution bandwidth (RBW): sets the width of the resolution bandwidth filter, which is a qualitative measure of the minimum separation required between two frequency components to be able to visually separate them. For further information refer to the help file of the instrument
- Video bandwidth (VBW): sets the width of the video bandwidth filter, which is located just after the envelope detector to smooth the envelope and determine the ability to discriminate between two power levels
- Sweep time: is used to automatically compute the best value of RBW and VBW filters in order to propose the best measurement resolution with the sweep time order
- Averaging count: sets the number of sweeps to compute the average powerNote: Once the template is done, it's possible to save or recall it using
 icons.Note: When Modulation Measurement Panel: Source Setting is set to "From Waveform Generator", ACPR setting are automatically updated using the waveform generator ACP definition.
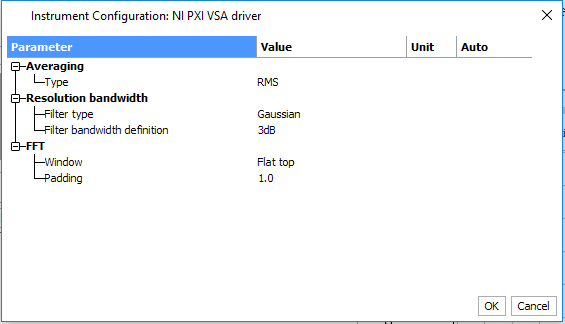
Advanced options: access specific ACPR options in the driver (type of filter …) which depends on the instrument used. Below, is shown an example of advanced options for Ni PXI VSA
Complementary, cumulative Density Function (CCDF)
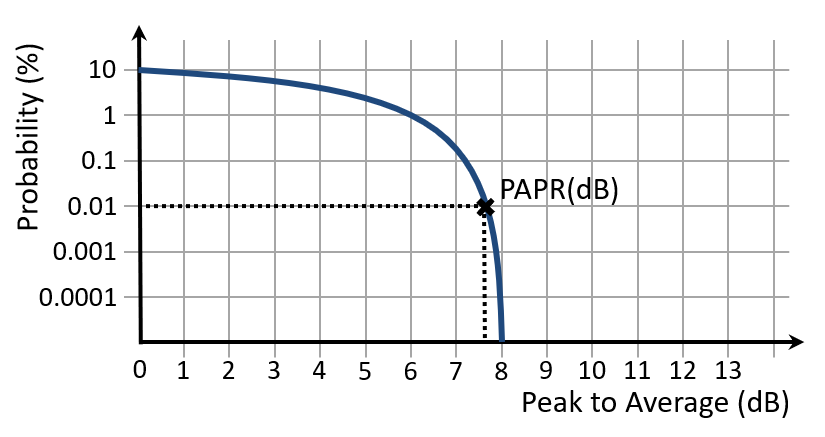
CCDF is a statistical distribution of the waveform power calculation performed in time domain. This measurement provides insight of instantaneous power as a function of time. To configure the measurement, set the interval, the number of record and bandwidth integration.
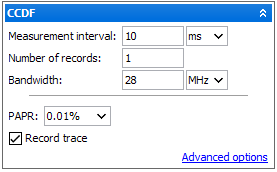
PAPR selection (in %) is used to record the value of PAPR data for a certain probability. 'Record Trace' check box allows to save the CCDF trace in the *.imx files for each power and each frequency (IQSTAR Measurement Files). Below is an example of CCDF with a PAPR (peak to average power ratio) equal to 7.8dB for 0.01% probability of time.
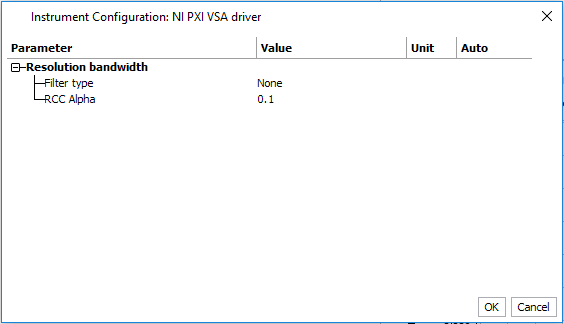
Advanced options: access specific CCDF options of the driver (type of filter …) which depends on the instrument used. Below, is an example of advanced options for Ni PXI VSA
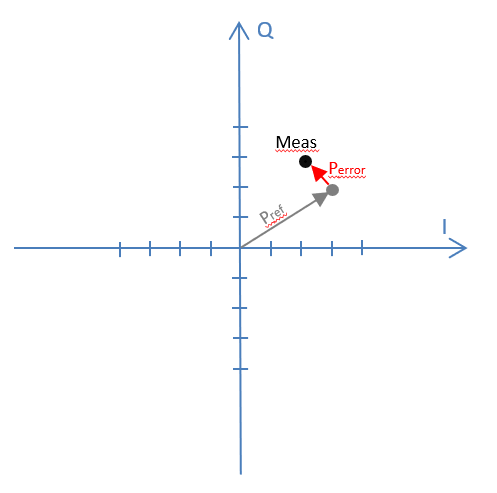
Error Vector Magnitude (EVM data).
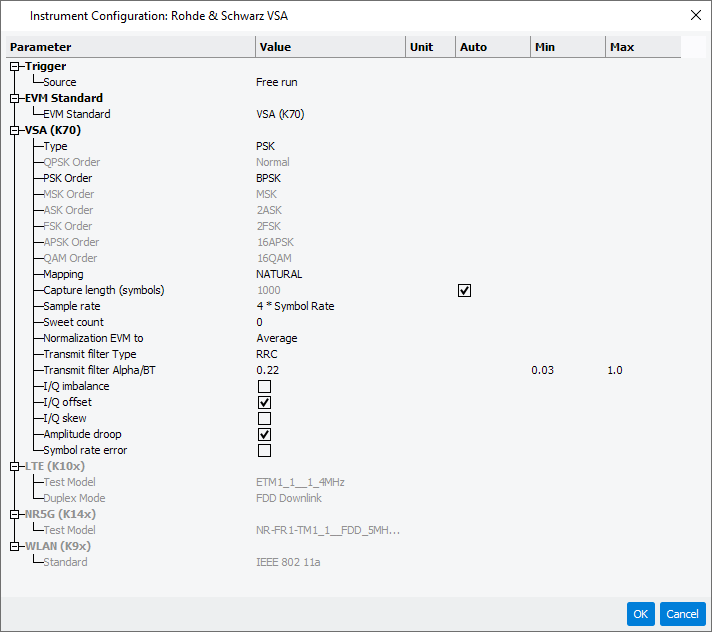
The Error vector Magnitude (EVM) quantifies the in-band distortion generated by the DUT. This feature capabilities depend on the instrument used, therefore the measurement options are related to the 'advanced options' of each Vector Signal Analyzerdrivers. (e.g: R&S FSW including K70 option)
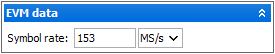
The main setting is the symbol rate of the output waveform.
Advanced options: access specific EVM options of the driver (type of digital demodulation, filter, compensation, …) which depends on the instrument used. Below, is an example of advanced options for R&S VSA
Spectrum
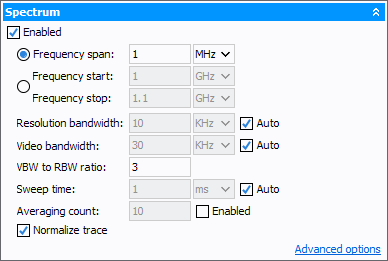
- Frequency Span: sets the width of the frequency band to be analyzed
- Frequency Start / Stop: sets the start and stop frequency to be analysed
- Resolution bandwidth (RBW): sets the width of the resolution bandwidth filter, which is a qualitative measure of the minimum separation required between two frequency components to be able to visually separate them. For further information refer to the help file of the instrument
- Video bandwidth (VBW): sets the width of the video bandwidth filter, which is located just after the envelope detector to smooth the envelope and determine the ability to discriminate between two power levels
- Video bandwidth (VBW) to Resolution bandwidth (RBW) ratio: sets automatically the VBW value in function of the RBW value following this ratio. In many spectrum analyzers, the VBW-to-RBW ratio is set to 1 by default, providing a small amount of averaging. In most cases, a VBW-to-RBW ratio of 0.1 sufficiently reduces the variance in the majority of signals to an acceptable level
- Sweep time: is used to automatically compute the best value of RBW and VBW filters in order to propose the best measurement resolution with the sweep time order
- Averaging count: sets the number of sweeps to compute the average power
- Normalize trace: normalizes to trace with the maximum as a reference (the trace points will never be greater than this reference)
Advanced options: access specific Spectrum options in the driver (type of filter, detector, …) which depends on the instrument used. Below, is an example of advanced options for Ni PXI VSA

Custom Data
Custom data measurement allows to define custom SCPI commands to set Vector Signal Analyzer and fetch custom data for each power level and each frequency sweep. It is useful to use dedicated internal vector signal analyzer options.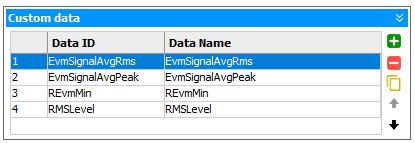
Press
to
create a new data. or
or  )
defines order of SCPI commands execution.
)
defines order of SCPI commands execution.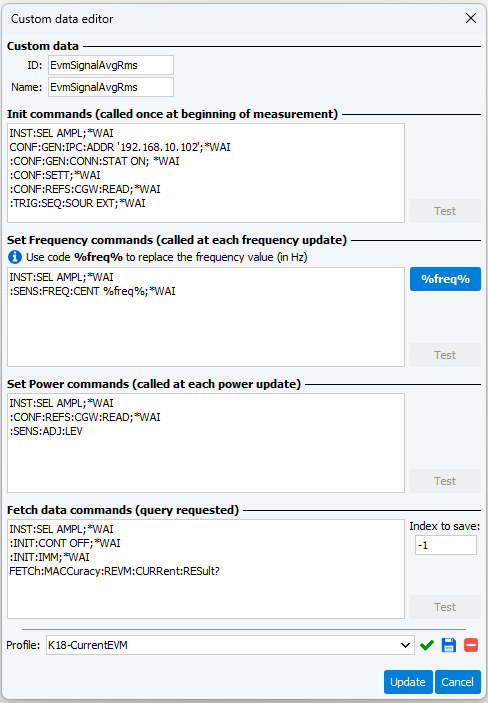
First define ID and Name of the user data. Then define SCPI commands for each measurements step :
- Initialization Commands : These commands will be send when Start
measurement button (
 ) will be pressed.
 - Set Frequency commands : These commands will be send at each frequencies of the frequency sweep. This can be use to set frequency in the instruments
- Set Power commands : These commands will be send at each power levels of the power sweep . This can be use to adjust the reference levl of the Vector Signal Analyzer.
- Fetch Data Commands : These commands has to be finished by a query to fetch the data form the Vector Signal Analyzer. "Index to save" define the value to keep when the instrument returns a vector of values.
Each data can be saved as profile using