The extension of files is .imx. The x indicates that the file has
been compressed (for size and import speed reasons).
A IM file can contains one or more measurements. It allows several measurement
types in the same file. Example in Setup Editor, you can
exported all your measurement in one file.
As mentioned above, measurement file is compressed, so the file cannot be read
by a text editor.
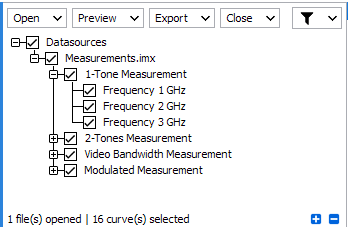
Structure
A IM file is structured like this:
In top of the structure, each measurement is listed. The name of the
measurement is defined in the measurement configuration panel
For each measurement, there are curves. In IQSTAR, a curve is defined by
a frequency. The name of the curve will be the frequency definition
Each point of the curve represents a power measurement
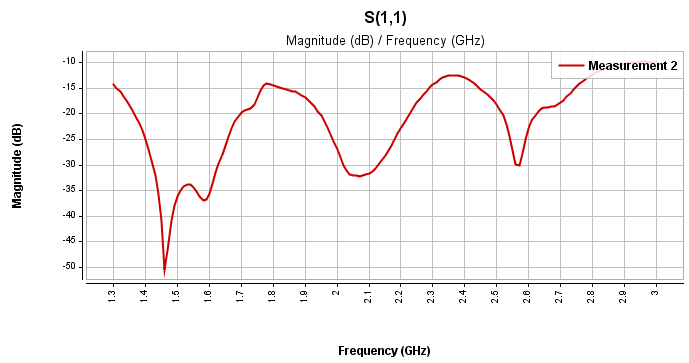
S-Parameters curves
Unlike S-Parameters Files, S-Parameters measurements can be append using this type of file.
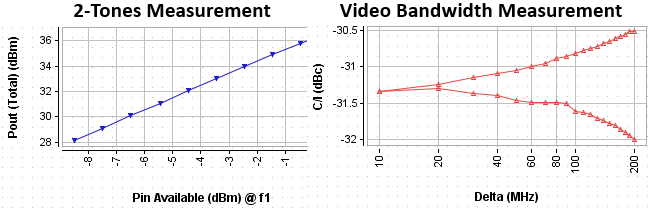
The Video Bandwidth Measurement perform a delta sweep, not a power sweep as
2-Tones Measurement. Each point of the curve represents a power measurement at
different delta.
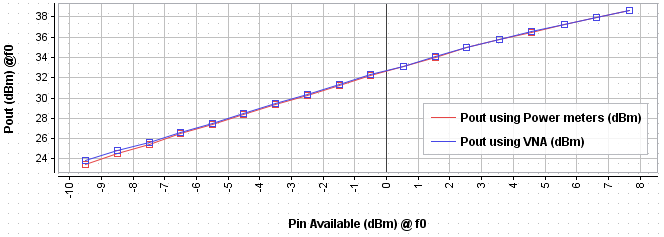
Power Sweep Using VNA: for the classic measurement
Measured data: A1, B1, A2, B2
Power Sweep Using Power Sensors: measurement has been performed using input, reflect and output power meters
Measured data: Pin Available, Pin Delivered, Pout
Video bandwidth Using VNA: for the measurement with the same name
Measured data: A1, B1, A2, B2
Video bandwidth Using Power Sensors: for the measurement with the same name
Measured data: Pin Available, Pin Delivered, Pout
Full list of computed data is available here: 2-Tones Data
Note: Computed data of Video Bandwidth curve are the same as data of 2-Tones curve.
Modulated curves
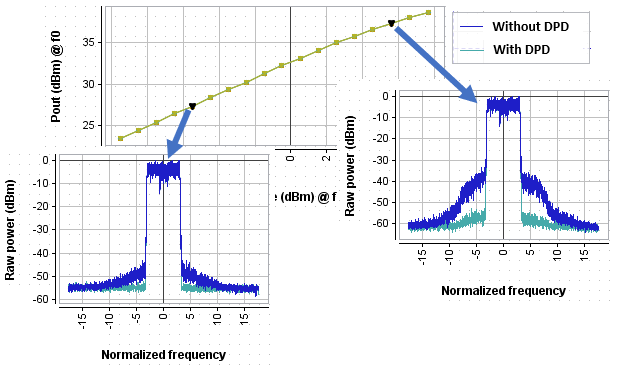
This type of curve has a particularity, for each power measurement, several traces are recovered.
Modulated Power Sweep: measurement has been performed using
input, reflect and output power meters (without DPD measurement)
Measured data: Pin Available, Pin Delivered,
Pout
Full list of computed data is available here: Modulated Data
Trace
A trace represents the values of modulated measurement (CCDF, Spectrum,
...) for a power value.
Unlike main curve, if DPD measurement is performed, there are two
traces for each modulated measurement (values with DPD and without DPD
are not stored in the same trace but two different traces).
This is the list of available traces:
Trace CCDF:
Measured data: Peak to average (expressed in dBm),
Probability (expressed in percent)
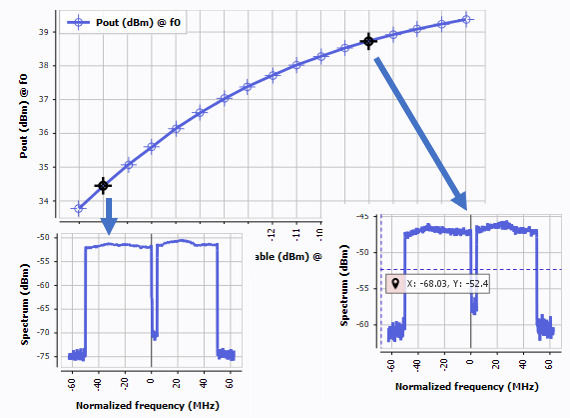
Trace Spectrum:
Measured data: Frequency (expressed in hertz),
Normalized frequency (expressed in hertz),
Time (expressed in second), Raw power
(expressed in dBm)
I/Q curves
For each power measurement, I/Q trace is recovered. Unlike Modulated curves, other data (CCDF, Spectrum,
...) are computed based on measured trace. Moreover, if DPD measurement are
performed, values are measured twice (with and without DPD).
Curve
Modulated Power Sweep: measurement has been performed using
input, reflect and output power meters
Measured data: Pin Available, Pin Delivered,
Pout
Full list of computed data is available here: Modulated Data
Trace
A trace represents the values of I/Q measurement for a power value.
Unlike Modulated curves, there is only
one trace with multiple levels.
This is the list of available level for I/Q trace:
Level I/Q:
Measured data: Time (expressed in second), I data
reference (expressed in volt), Q data
reference (expressed in volt), I data output
(expressed in volt), Q data output (expressed in
volt)
Computed data: Reference Abs|envelope| (expressed in
volt), Reference Phase|envelope| (expressed in
degrees), Reference Magnitude|envelope| (expressed in
dBm), Output Abs|envelope| (expressed in volt),
Output Phase|envelope| (expressed in degrees),
Reference Constellation, Demodulated
Constellation