Modulation Real-Time Measurement Display
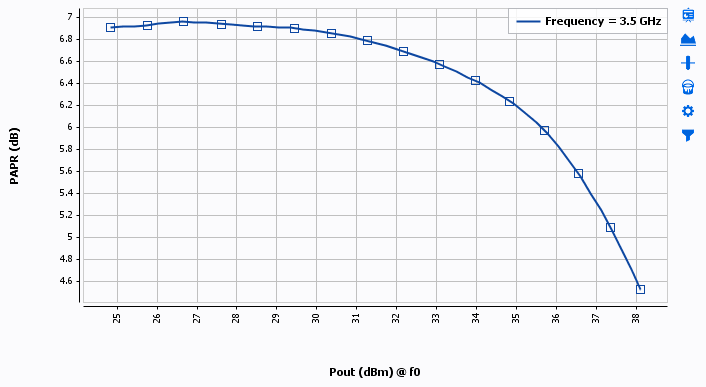
Number of configurations, like windows display, history, visualization profile and Graph Configuration for modulated signal graphs are similar to 1-Tone Real-Time Measurement Display. If no Receiver measurements are selected, IQSTAR will proceed with the measurement of power and IV characteristics and will only display Powers, Gain, IV and efficiency, as done in 1-Tone Measurements. Depending on the selected Receiver measurements, the graph data and graph types are updated in order to display appropriate data or traces.
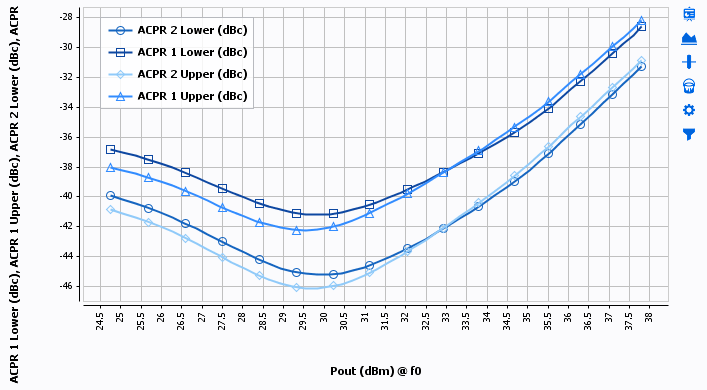
Adjacent Channel Power Ratio (ACPR)
Regarding the definition of the ACP template, IQSTAR displays ACPR (lower/upper) for each adjacent channels described.
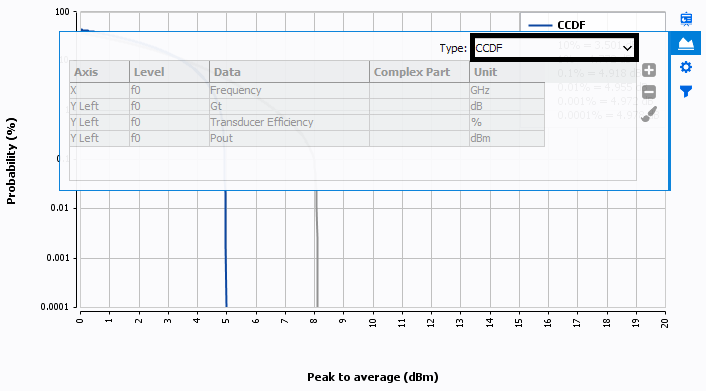
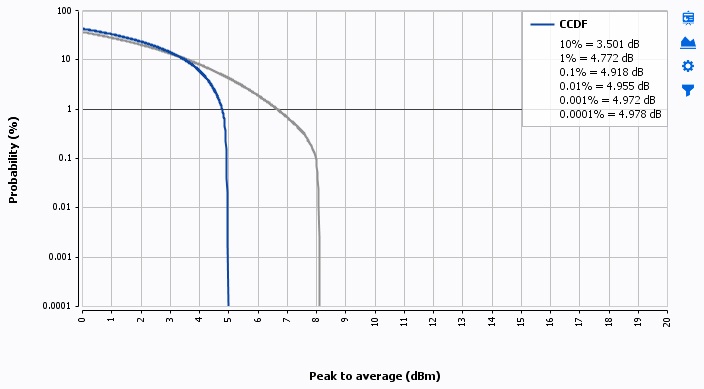
Complementary, cumulative Density Function (CCDF)
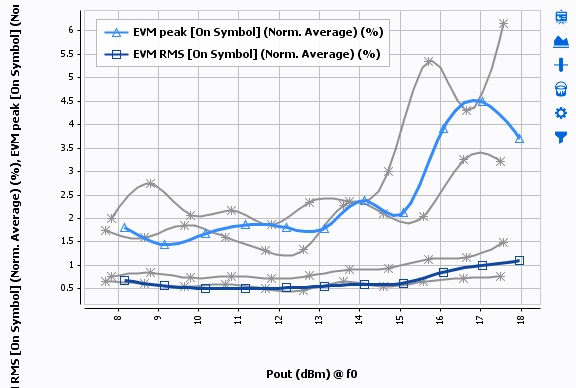
Error Vector Magnitude (EVM data).
- EVM Reference: RMS and peak values
- Modulation Error Rate (MER): RMS and peak values
- Magnitude Error: RMS and peak values
- Phase Error: RMS and peak values
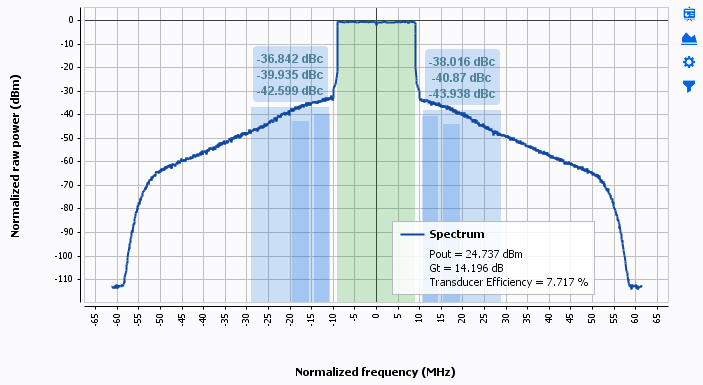
Spectrum
If 'Spectrum' is configured, IQSTAR will display the baseband signal. Notice that Spectrum is also a special type of graph, select Trace Graph Mode then Spectrum in theGraph Configuration :
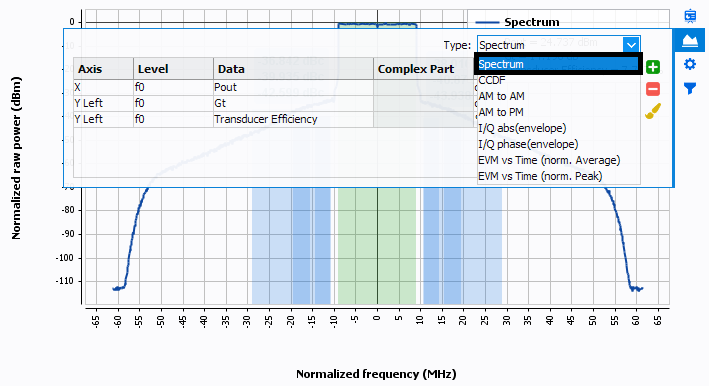
Moreover if 'Spectrum' measurements are associate with 'Adjacent Channel Power' measurements, IQSTAR will display the Spectrum and superimpose the ACPR masks.