
Limits Specifications
'Limit Specs' feature quickly and easily helps to identify whether the device is in PASS or FAIL status compared to a predefined specification.
1-tone example
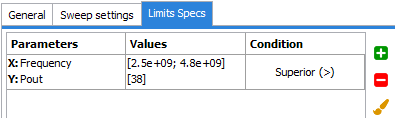
'Limits Specs' will display a limit bar on the graph during 1-Tone measurements. In order
to add a limit bar, click on  to open limits specification:
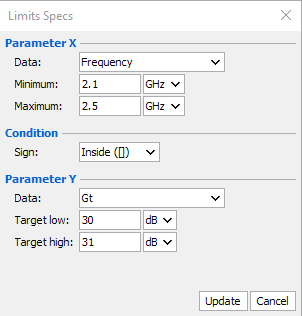
- Parameter X:
- Data: select the data for X-axis
- Min and Max: set the maximum and minimum value of limits
-
Condition:
-
Sign: set the condition (Equal, Inferior, Superior, Inside, Outside)
-
- Parameter Y:
- Data: select the data for Y-axis
- Low and high: set the values that the condition must satisfy
In the proposed example, the transducer gain must be comprised between 30 and 31 dB in the frequency band of 2.1 to 2.5GHz.
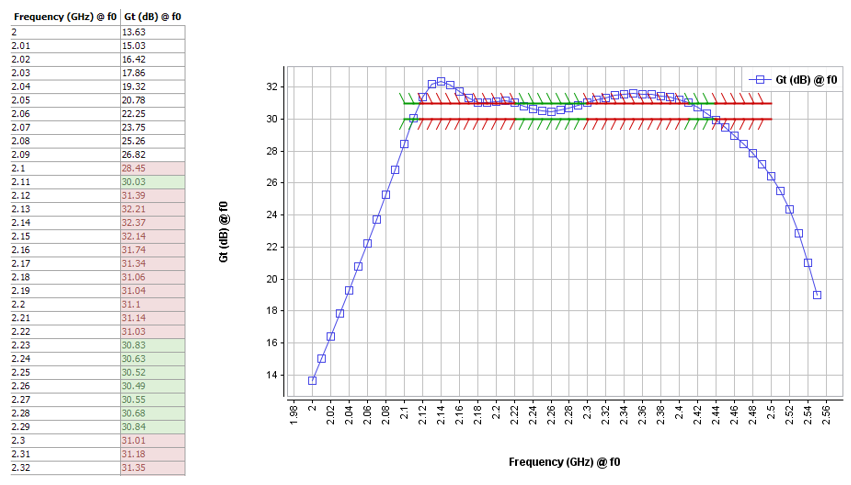
If the conditions are respected, the limit bars stay green in the graph and in the table, otherwise the values and the limits are set in red.
2-tones example
'Limit Specs' feature quickly and easily helps to identify whether the device is in PASS or FAIL status compared to a predefined specification.
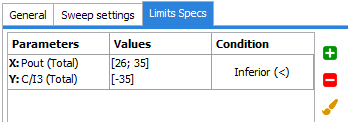
'Limits Specs' will display a limit bar on the graph during 2-Tone measurements. In
order to add a limit bar, click on to open the limits specification:
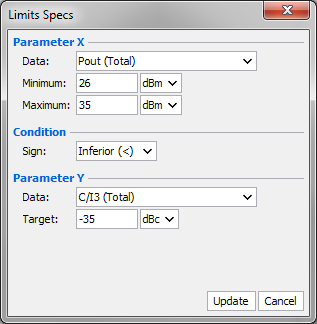
In the proposed example, the IMD3 total must be below -35dBc for an output power between 26 and 35 dBm.
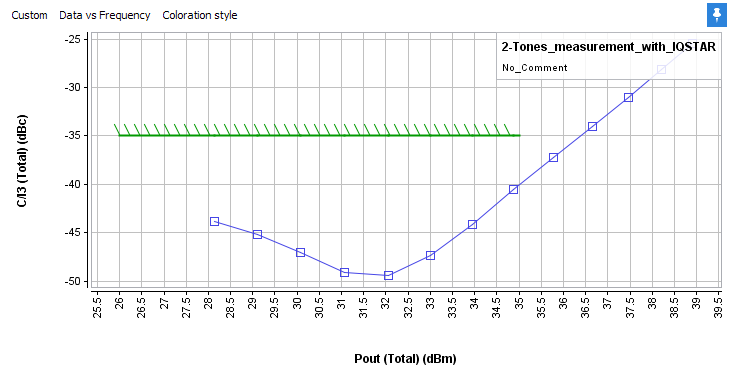
If the conditions are respected, the limit bars stay green in the graph and in the table, otherwise the values and the limits are set to red.
I/Q example
'Limit Specs' feature quickly and easily helps to identify whether the device is in PASS or FAIL status compared to a predefined specification.
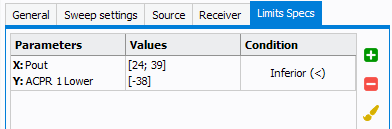
'Limits Specs' will display a limit bar on the graph during ACPR measurements. In
order to add a limit bar, click on to open the limits specification:
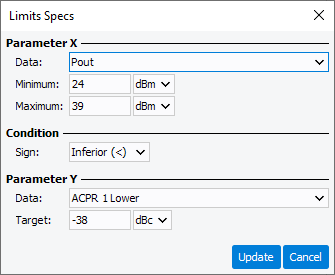
In the proposed example, the ACPR must be below -38dBc for an output power between 24 and 39 dBm.
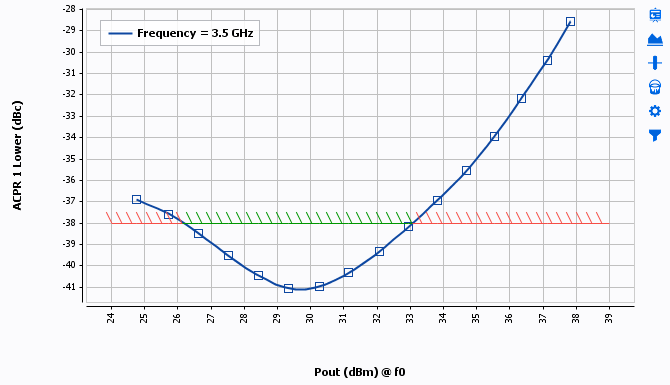
If the conditions are respected, the limit bars stay green in the graph and in the table, otherwise the values and the limits are set to red.