The Whiteboard Editor WHIT-10 module allows engineers to develop their ideal data analysis templates.
If in your workflow :
- You struggle with the limitation of your visualization Tool.
- You need to switch between different interfaces with different tools for different file formats.
- You need to manipulate multiple files to analyze some information.
- The number of graphs and displayed parameters is limited.
- You want to adjust your workspace to explore more in-depth the results obtained.
- You want to be more creative in the manner of presenting your results.
Then, the Whiteboard Editor is for you. This one allows the development of flexible data analysis templates tailored for your needs. It allows adjusting the visualization parameters and contains the necessary controls to make the interface more user-friendly and easier to read.
The Whiteboard supports different measurement data in several formats given by IVCAD, IQSTAR, or third-party measurement platforms. You can easily display
- S-Parameters
- Nested frequency and Power measurement sweeps
- Modulated Signal measurements for different parameters
- Load Pull data to design matching circuits
Defaults graphs are proposed according to the file formats and the data content. Drag on drop the chart frame, and pre-optimized figures are then displayed.
When using simulation tools such as VISION or third-party RF simulators, data files can be multidimensional with customized parameters. Because of the potentially unlimited number of
dimensions explored during the simulation work, the Whiteboard is an unrivaled tool when both flexibility and performance are needed to extract the files’ core information.
If it’s important to display the behavior of the design or the device under multiple conditions, the Whiteboard data illustration is based on a “Parent-Child” structure. This characteristic allows each control
(Graph, Tables, Wafer, Filters…) to use data from either the input file or another control.
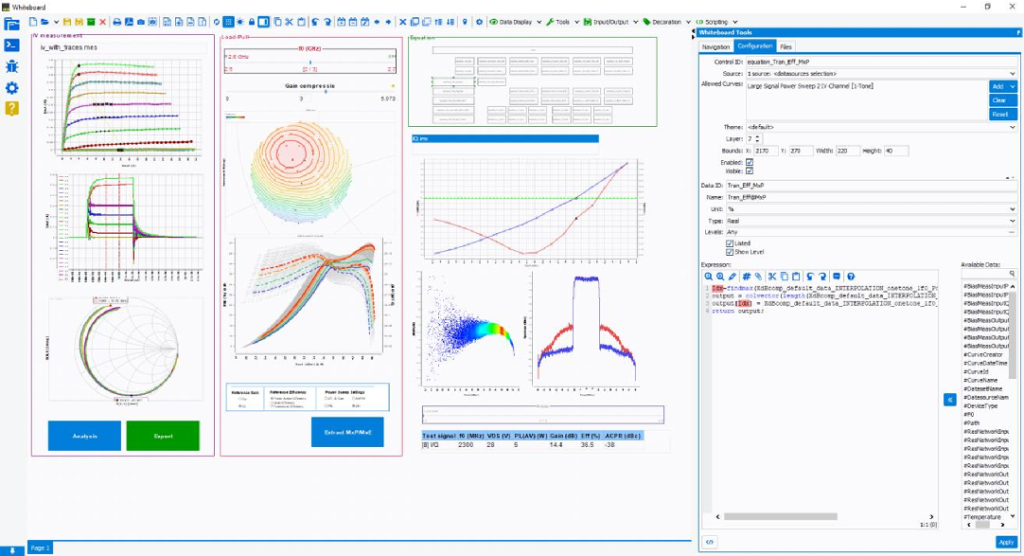
Using a multipage structure, the analysis tool offers the possibility to arrange the workspace in dedicated sections for an enhanced user experience. The data can be displayed in different formats:
• Graphs (XY, Polar, Smith Charts, 2D and 3D)
• Tables
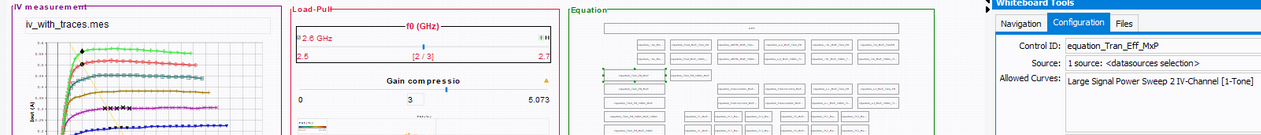
• Equations
• Pictures
Multiple controls are available to navigate through the data and extract desired parameters:
- Filters allow displaying curves at specific conditions like frequency, date, temperature…
- Converters allow converting specific curve types (S-parameters, Power Sweep, Video-Bandwidth, Modulated Power Sweep…) into “Generic” ones to compare data from different sources.
- Mergers allow merging multiple curves type in one.
- Extractors allow extracting curve values at specific conditions (Pout level, Pin level, Gain compression, ACPR level …) through an interpolation process.
- Stackers allow stacking multiple curves to generate 3D graphs.
The user has full control of each graph’s position, and size and the interface can be enhanced with explanatory text, banners, and images to make the analysis experience clearer and more user-friendly.