
2-Tones Real-Time Measurement Display
Configurations such as windows display, history or visualization profile, of 2-tone graph are similar to S-Parameters Real-Time Measurements Display. Moreover the 'Graph configuration' is equivalent to 1-Tone Real-Time Measurement Display.
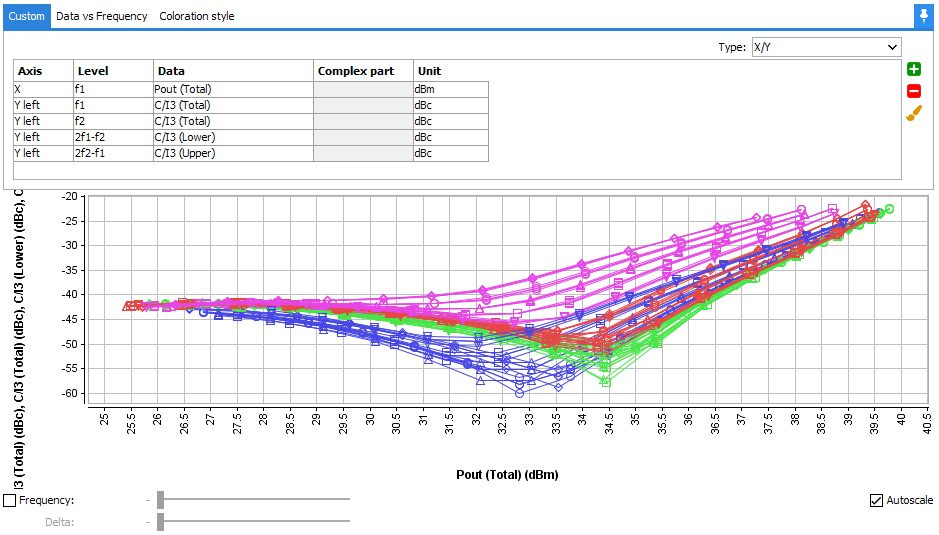
Graph configuration: the only difference with 1-Tone Real-Time Measurement Display is the data available in the graph such as C/Ix (x=3,5,7,9 depending of IMD order of the measurement).
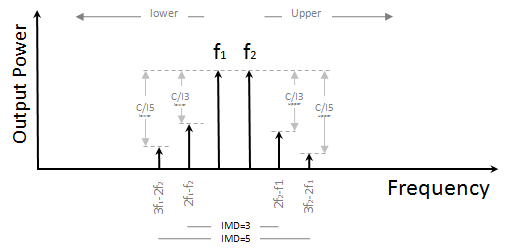
To configure the real-time graph viewer, select the correct frequency level (acquisition frequency) to have access to the corresponding data, as an example to display C/I3 (lower) the level must be set to 2f1-f2.
Frequency selector: in 2-Tones, the highlighted check box allows two degrees of selection: Frequency and Delta.
