
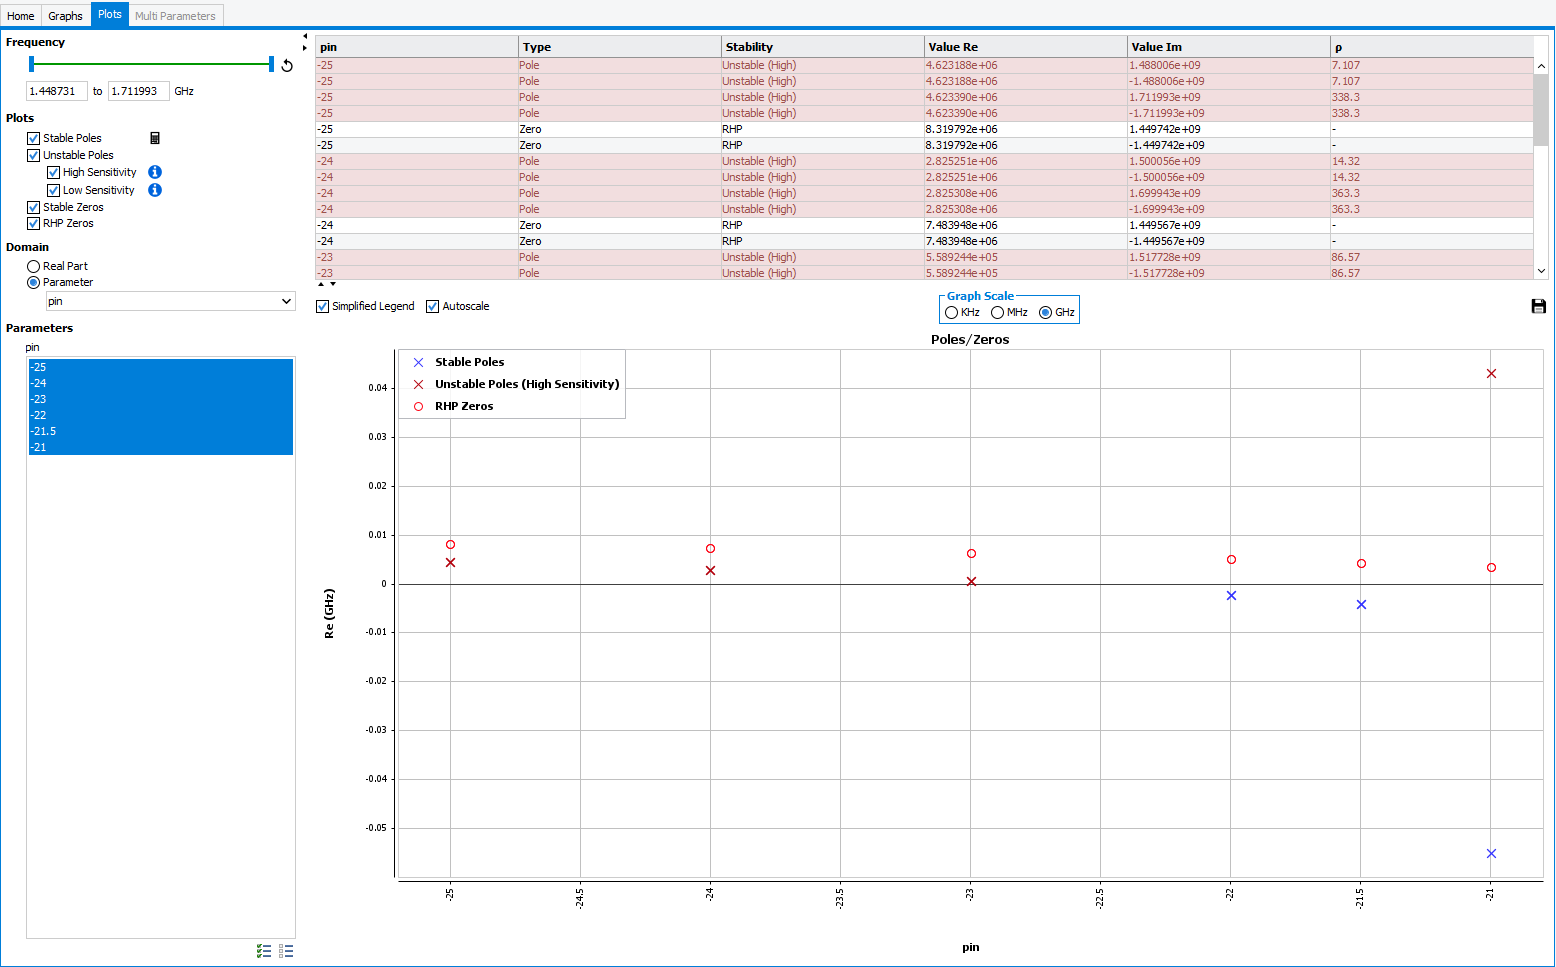
Stability Analysis for a parametric file
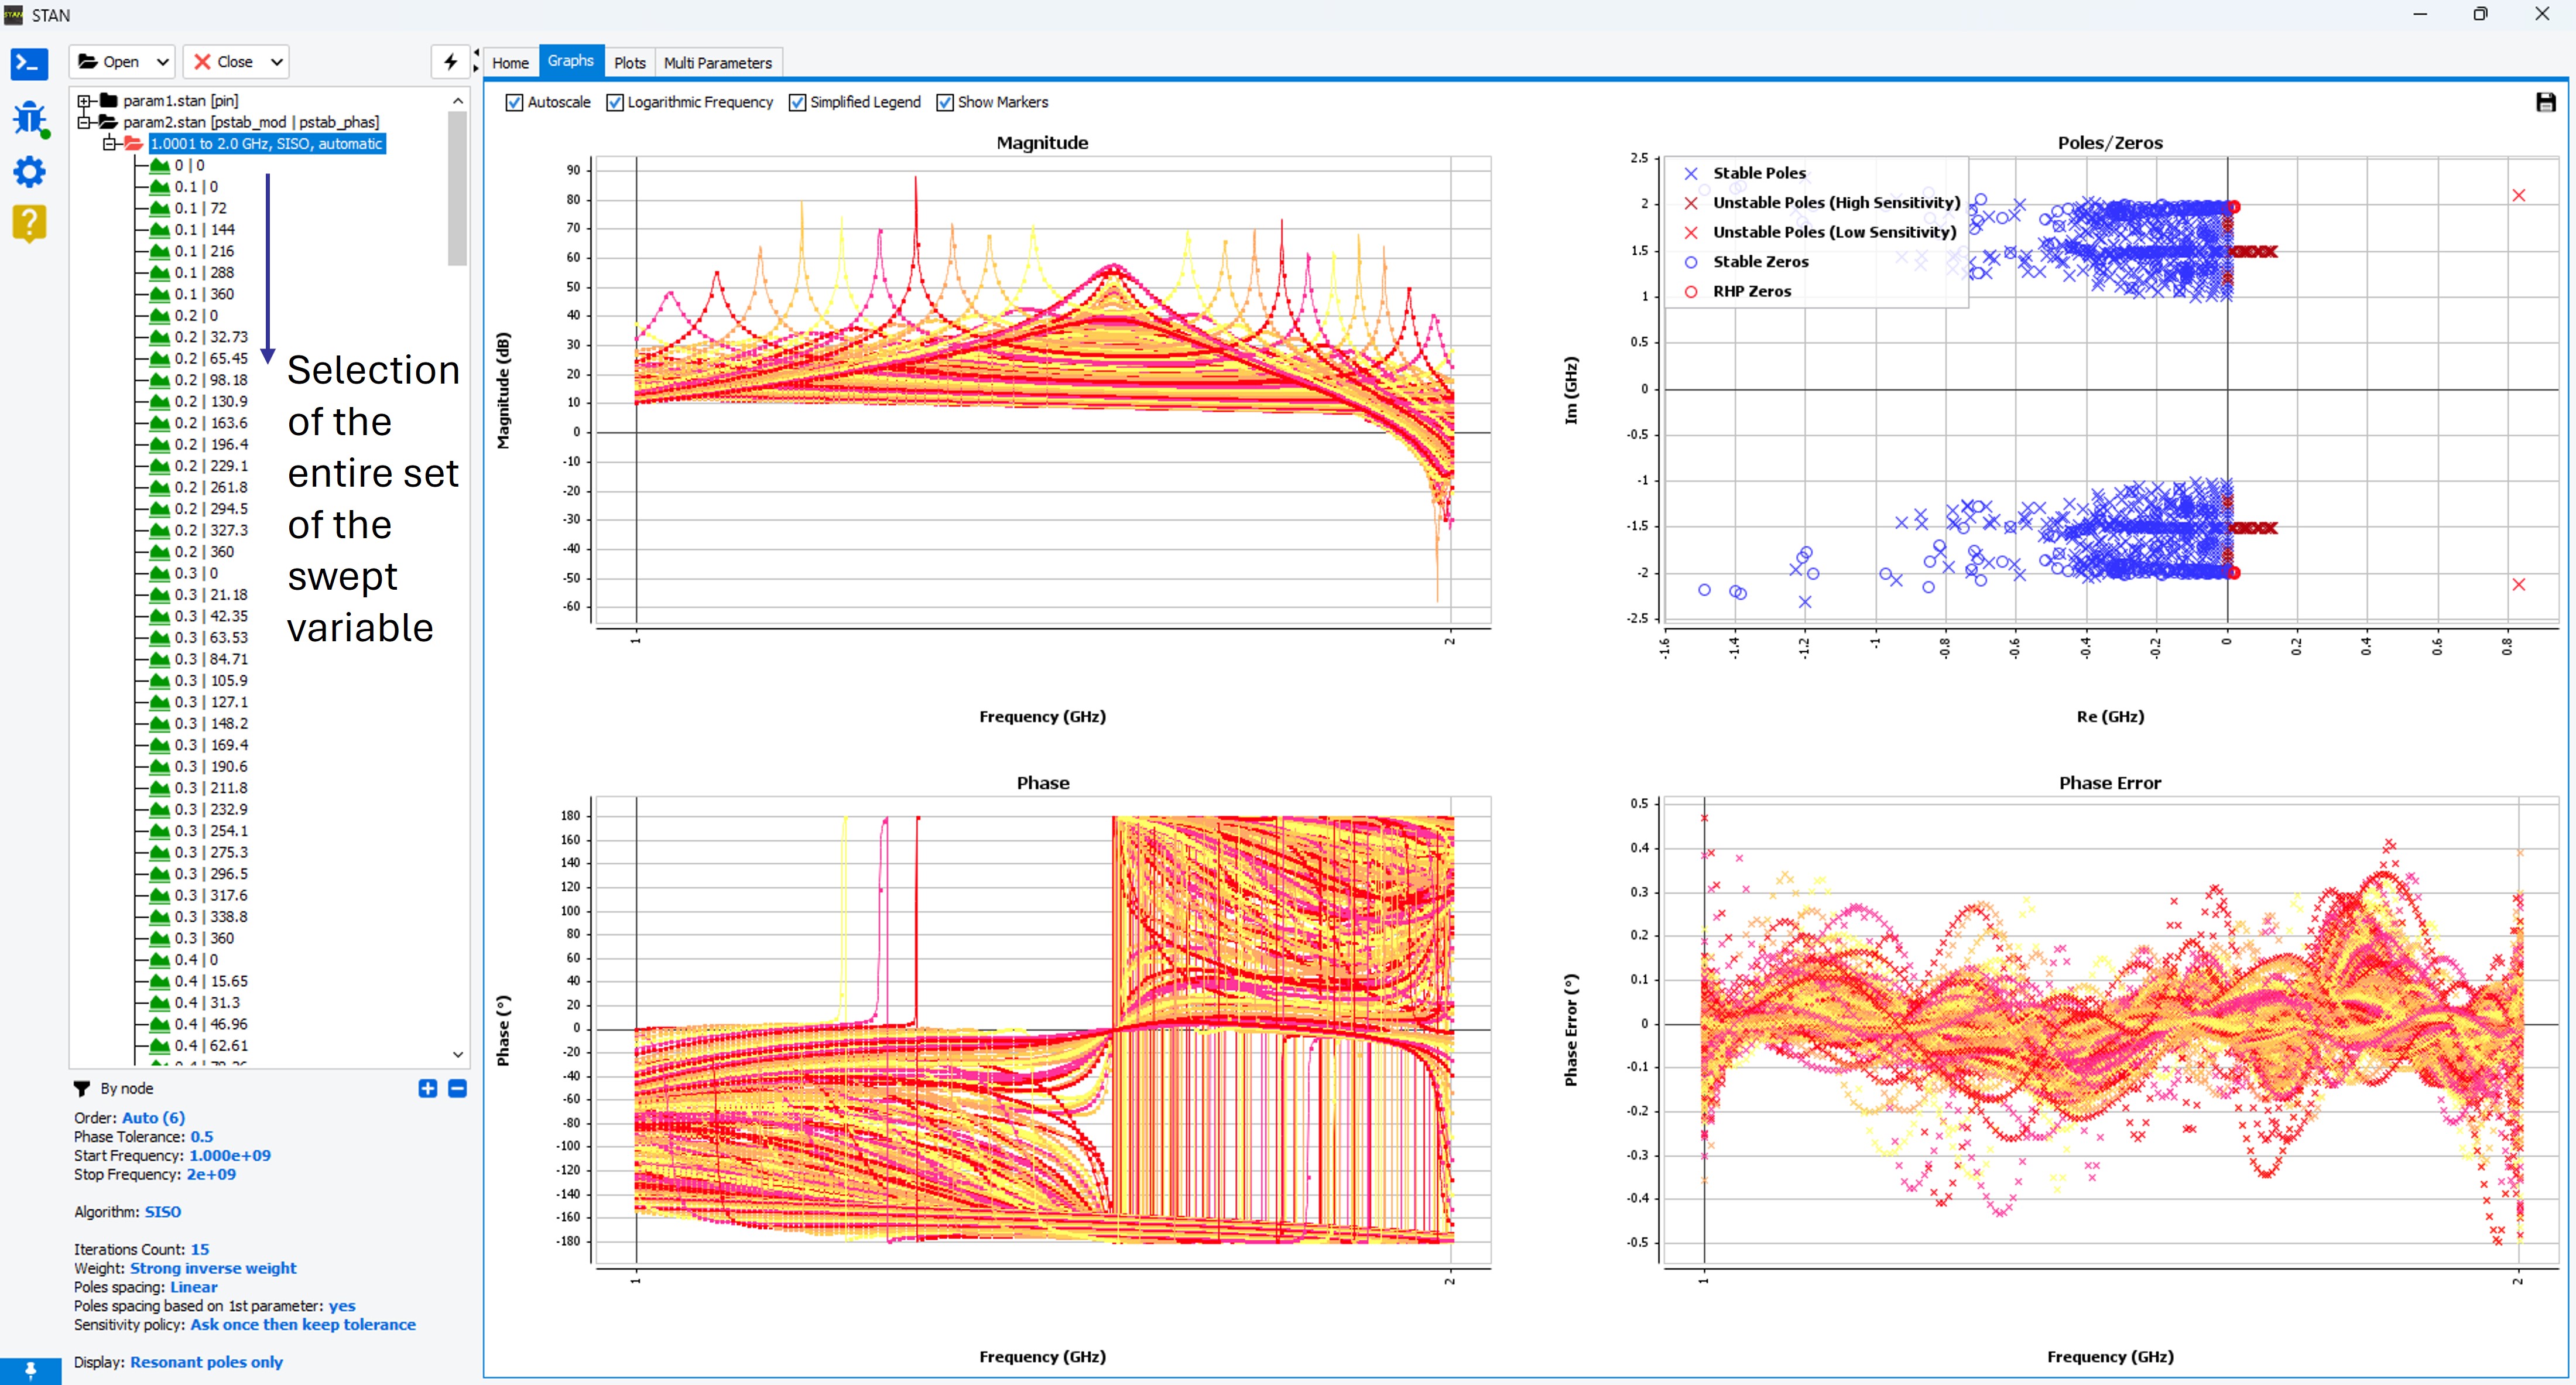
With this parametric analysis, the evolution of poles can be observed when varying the parameters. The value of the parameter at which the circuit becomes stable can be easily identified, Figure. In the Plot tab, it is possible to choose the domain where the plot is displayed, in function of the real part of the poles or function of a swept parameter. A drop-down menu is implemented to permit to choose in function of which parameter the poles are displayed.
If several parameters vary in the circuit (multimode, Montecarlo, multi-variable sweep) another tab is provided to map the poles in function of different parameters/nodes, “Multi Parameters” (Figure). Three graphs type are available, X/Y, Polar and Smith. The X and Y axis are selected thanks to a drop-down menu.
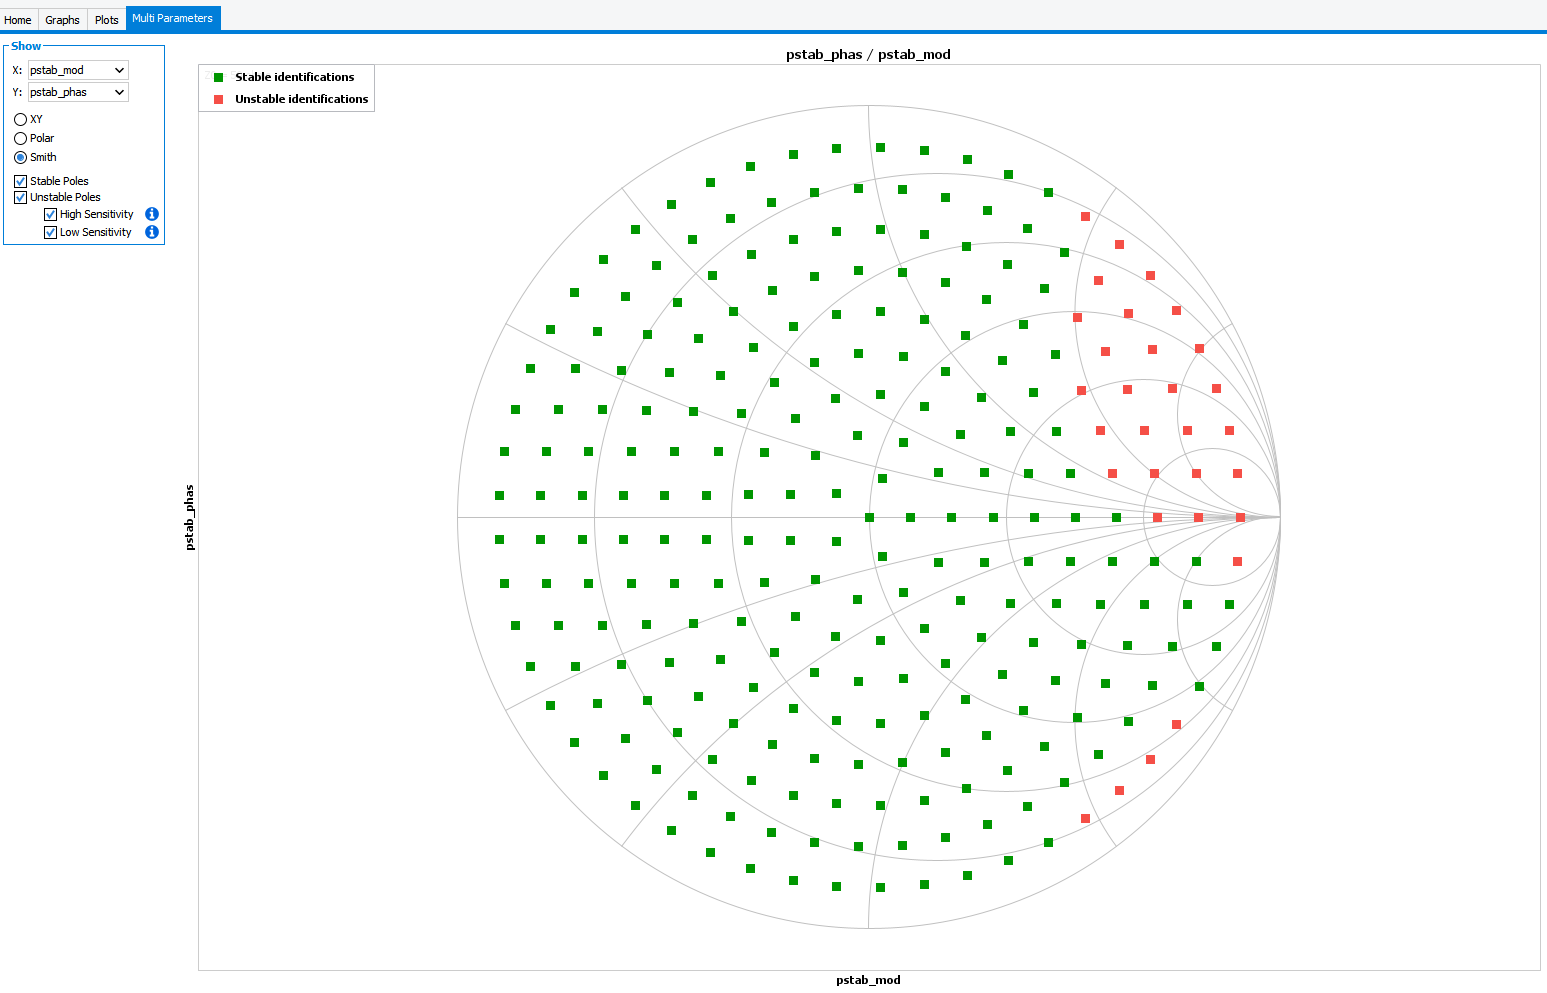
Note: the information given above for parametric analysis are applicable for multimode and Montecarlo analysis.