
Graph Results
The identification results will be presented as shown in the next figure, where different plots are displayed:
- In the tree it is possible to see the analysis informations, like frequency band, algorithm, order and the list of parameters, if the file contains sweep variables (parameters or nodes). A filter is available to permit to classify the analysis by node or by parameter.
- The Magnitude and Phase of the transfer function are plotted on the left side, with the original values represented in blue points and the identified function provided by STAN Tool in red solid line. In case of multiple selection on the tree the color policy change; indeed the original and identified curve have the same color (distinguishable by a line or dots). These two graphs enable the analysis of the fitting of the two functions in order to see if the identification is good enough and results are correct (tackling over-modeling effects).
- The top right graph displays the poles/zeros map, where poles are represented in crosses, x, and zeros in circles, o. The red color is used to highlight the unstable poles/zeros in the map.
- An export button is available to allow an exportation of the magnitude and phase data identified from the analysis.
- The phase error graph, bottom right, shows the phase error that highlights the accuracy of the identification. It should be smaller than the phase-tolerance value previously defined by the user.
- The legends of the graphs contain information about the analysis perform on the
file. That can be very useful in case of multiple analysis. The Legend can be
simplified or moved within the graph using the center button of the mouse.
Figure: STAN Tool results Graphs tab 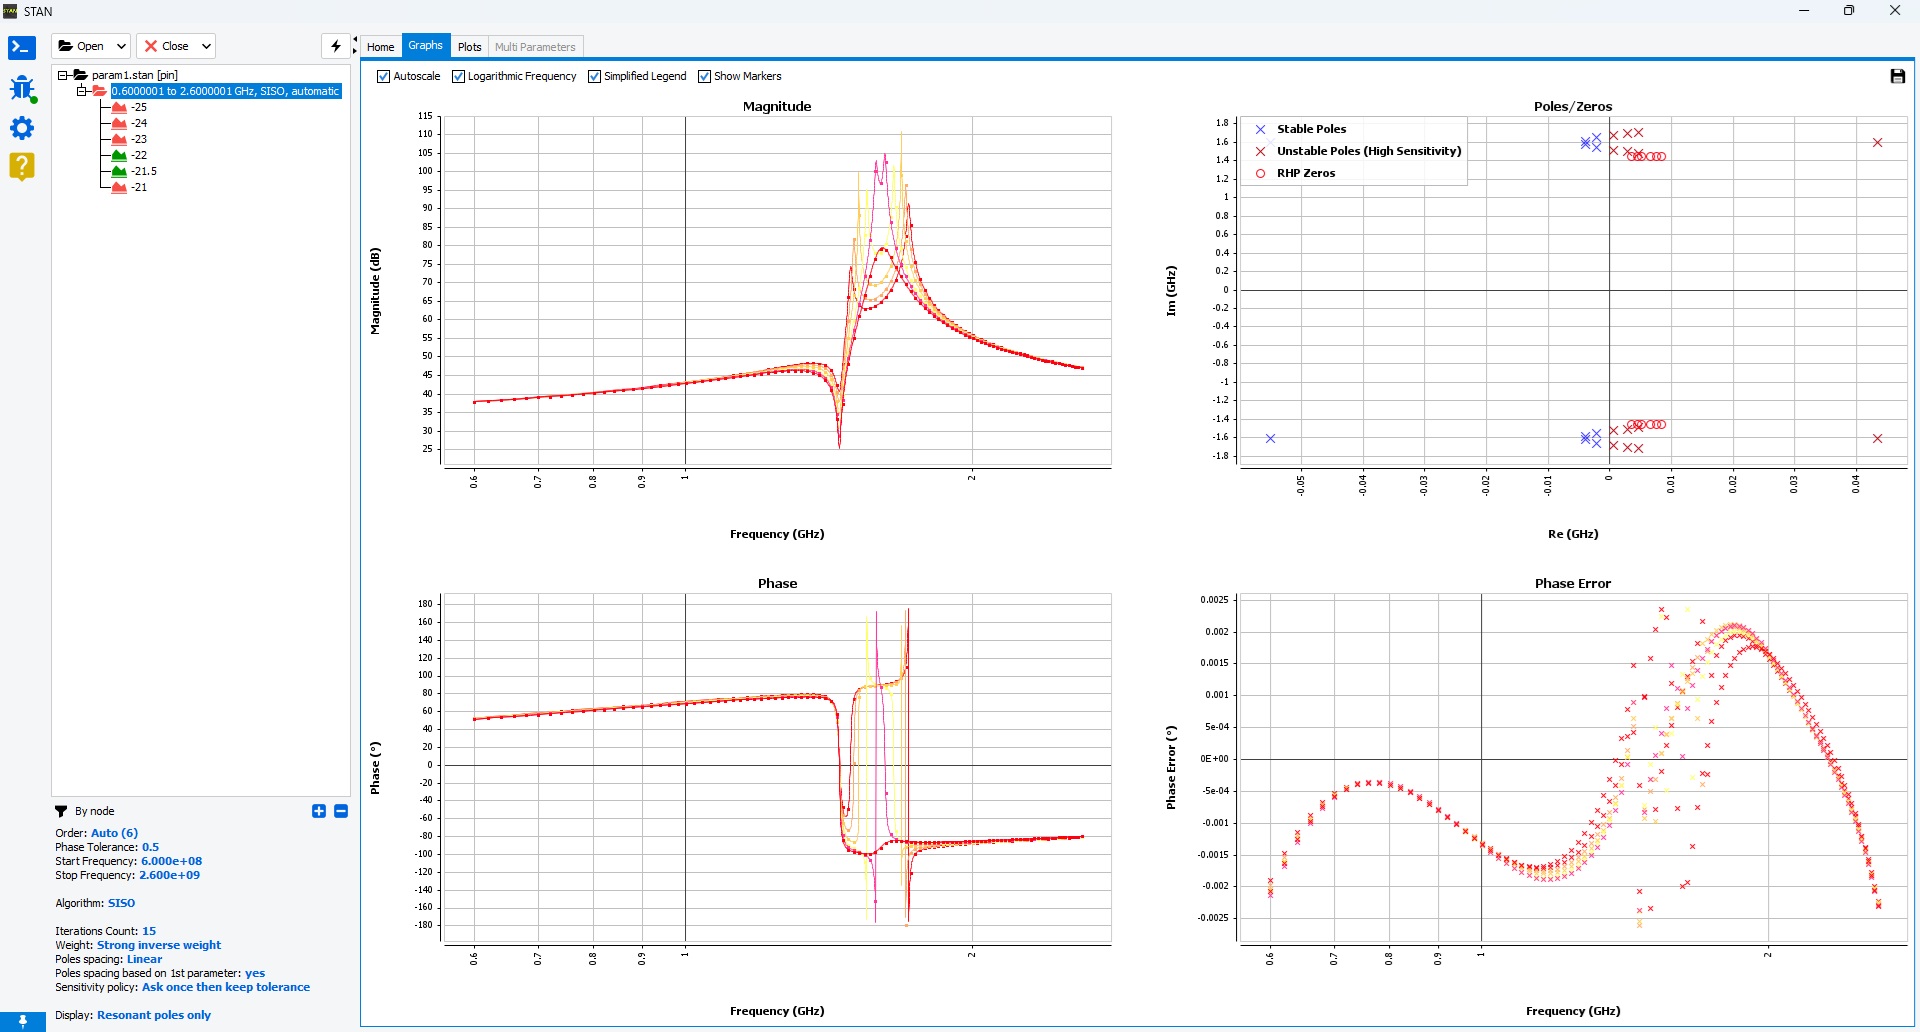
A Graph toolbar, is available on the top of the Grap tab :
- Autoscale box permits to disable the autoscaling of the graph, even if the user change the selection of the tree.
- X-axis can be plot with logarithmic scale to a better view in case of large frequency bandwidth thanks to the Logarithmic Frequency checkbox.
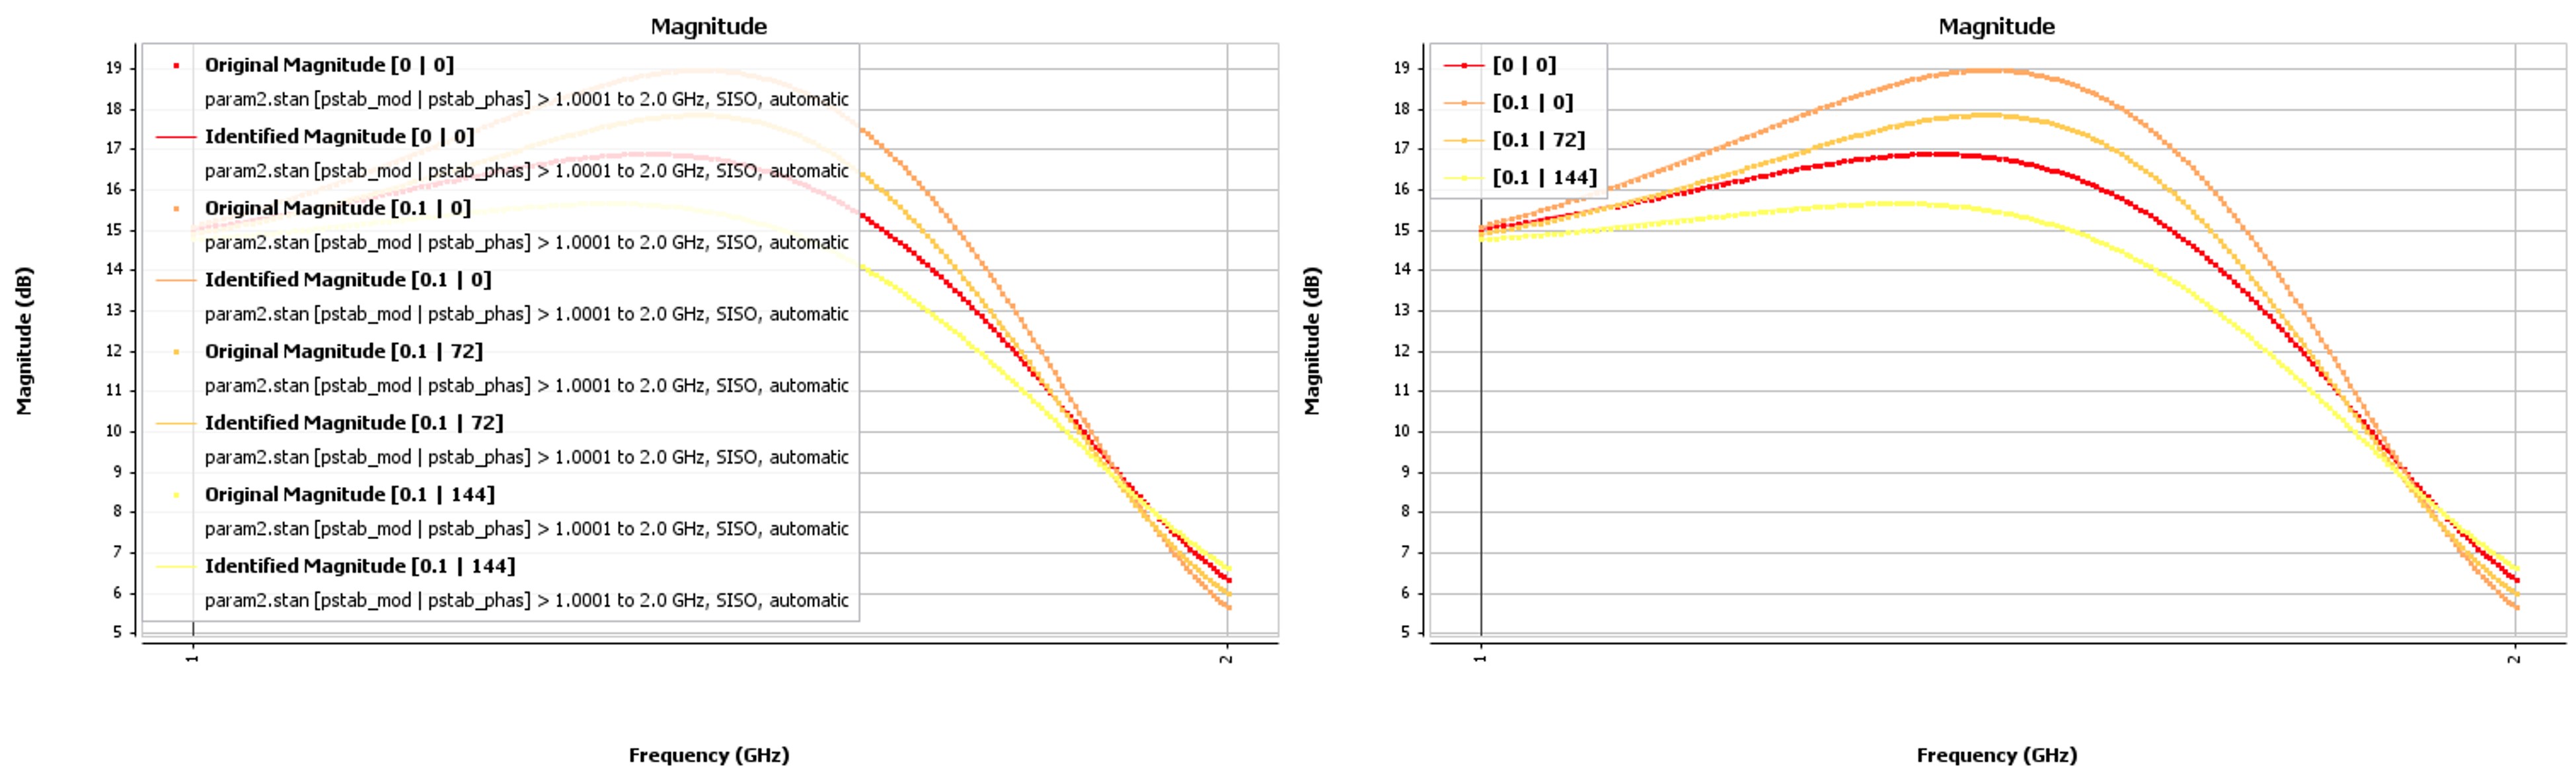
- Legend can contains a certain number of information in function of the selection
and the Simplified Legend checkbox allow to have a reduce legend with the
main information, see the figure below. The simplified legend given only the
parameter values in accordance to the tree selection.
- By checking the Show Markers check box, the points of the identified
function appear on the graph.
By default, all these boxes are checked.