Identification window
Once the file is selected, the “Identification” dialog box appears, where the parameters for the identification can be set up, Figure.
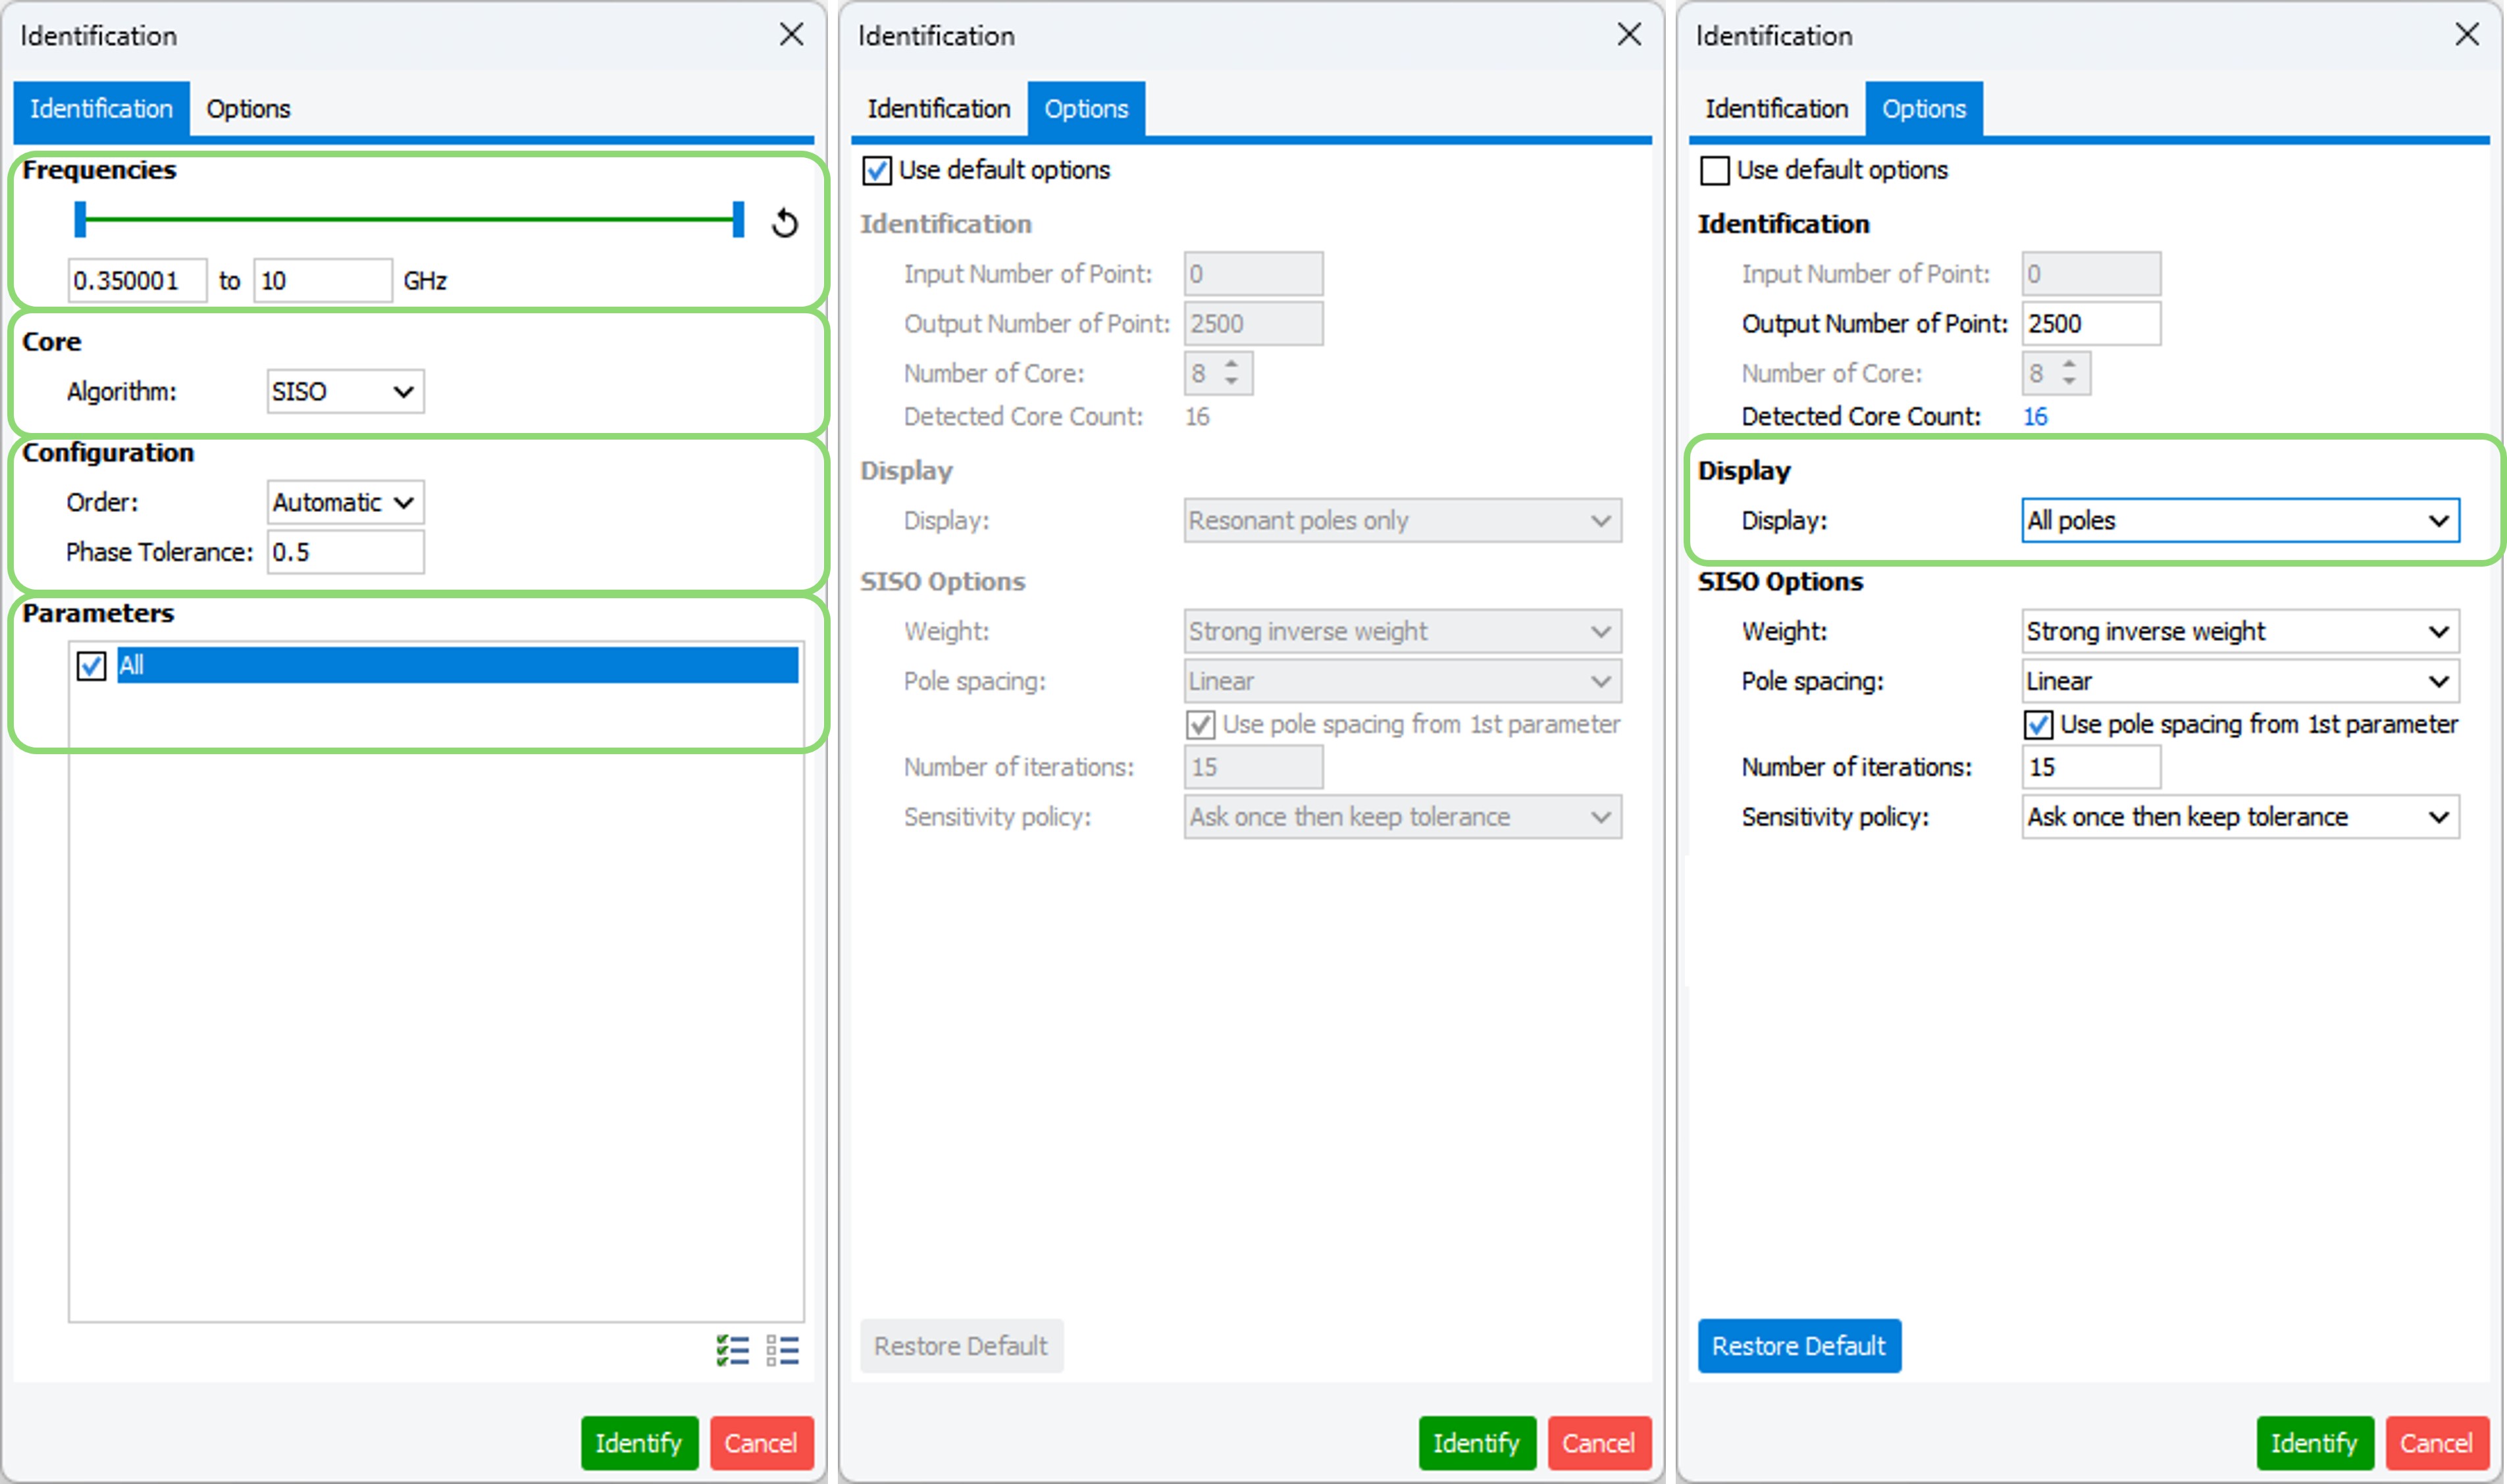
- Frequencies: the entire frequency bandwidth included in the file will be identified by default. A frequency band for the identification that is narrower than the simulated band can be defined, enabling a focus on critical (and narrower) parts of the frequency response when needed, improving the sensibility and accuracy of the identification.
- Core: two methods are available for the identification of the transfer
function: SISO and DACWIN. The SISO method is used by
default. Clicking on “Options” tab allow the user to have access to the parameters
of the two methods:
- Display: by default, only the resonant poles will be displayed in both methods. When using SISO all the detected poles can be displayed selecting display all poles, but they will be plotted only in the Graph tab. In the DACWIN method, all detected poles within the analysis band will be displayed.
- SISO and DACWIN Options: the parameters used by the two methods for the identification can be modified. However, using the default values is strongly recommended in both cases.
- Configuration: with this option, the user can choose the order of the
identification function H0 (s) used to fit the transfer
function H0(jωS) and the phase tolerance between
the original curve and identified curve. The order option in STAN Tool provides two different identification
paths:
- Automatic algorithm (Automatic): the algorithm will try to fit the transfer function through several iterations trying to keep the phase error under the phase tolerance value (0.5 by default). The automatic order methodology is based on an algorithm specifically designed to avoid the adverse effects of undermodeling and overmodeling in the identification process.
- Manual order: the user will set the order to be used for the identification process. It is recommended only to advanced users with good understanding of the technique and experience using it.
- Parameters: this box will show the values of the parameters when a
multi-parameters simulation has been performed (availability to “select all”,
“unselect all”), Figure.
Figure: Example of parametric analysis with parameters slection 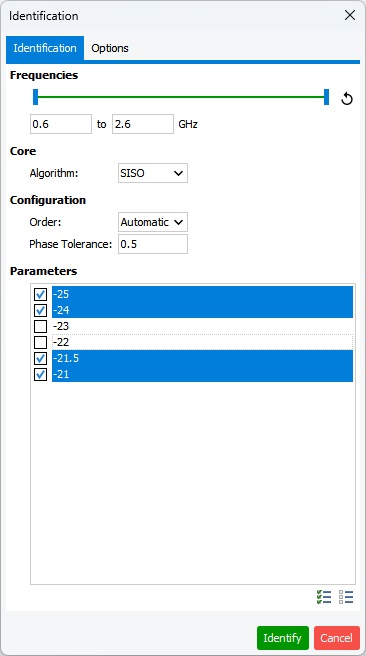
Click on the "Identify" button to launch the identification.
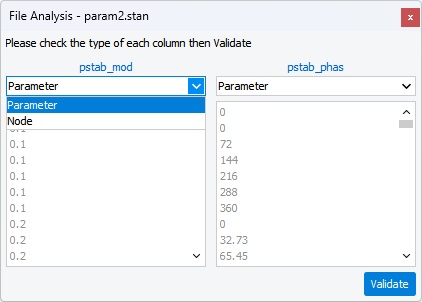
Note: If the selected file contains
swept parameters, the "File Analysis" window appears before the "Identification
window", to allow the user to see the different parameter contains in the file and
it is possible to choose if the sweep is relied to a parameter or a node.