
3-Tones Real-Time Measurement Display
Configurations such as windows display, history or visualization profile, of 3-tone graph are similar to S-Parameters Real-Time Measurements Display. Moreover the 'Graph configuration' is equivalent to 1-Tone Real-Time Measurement Display.
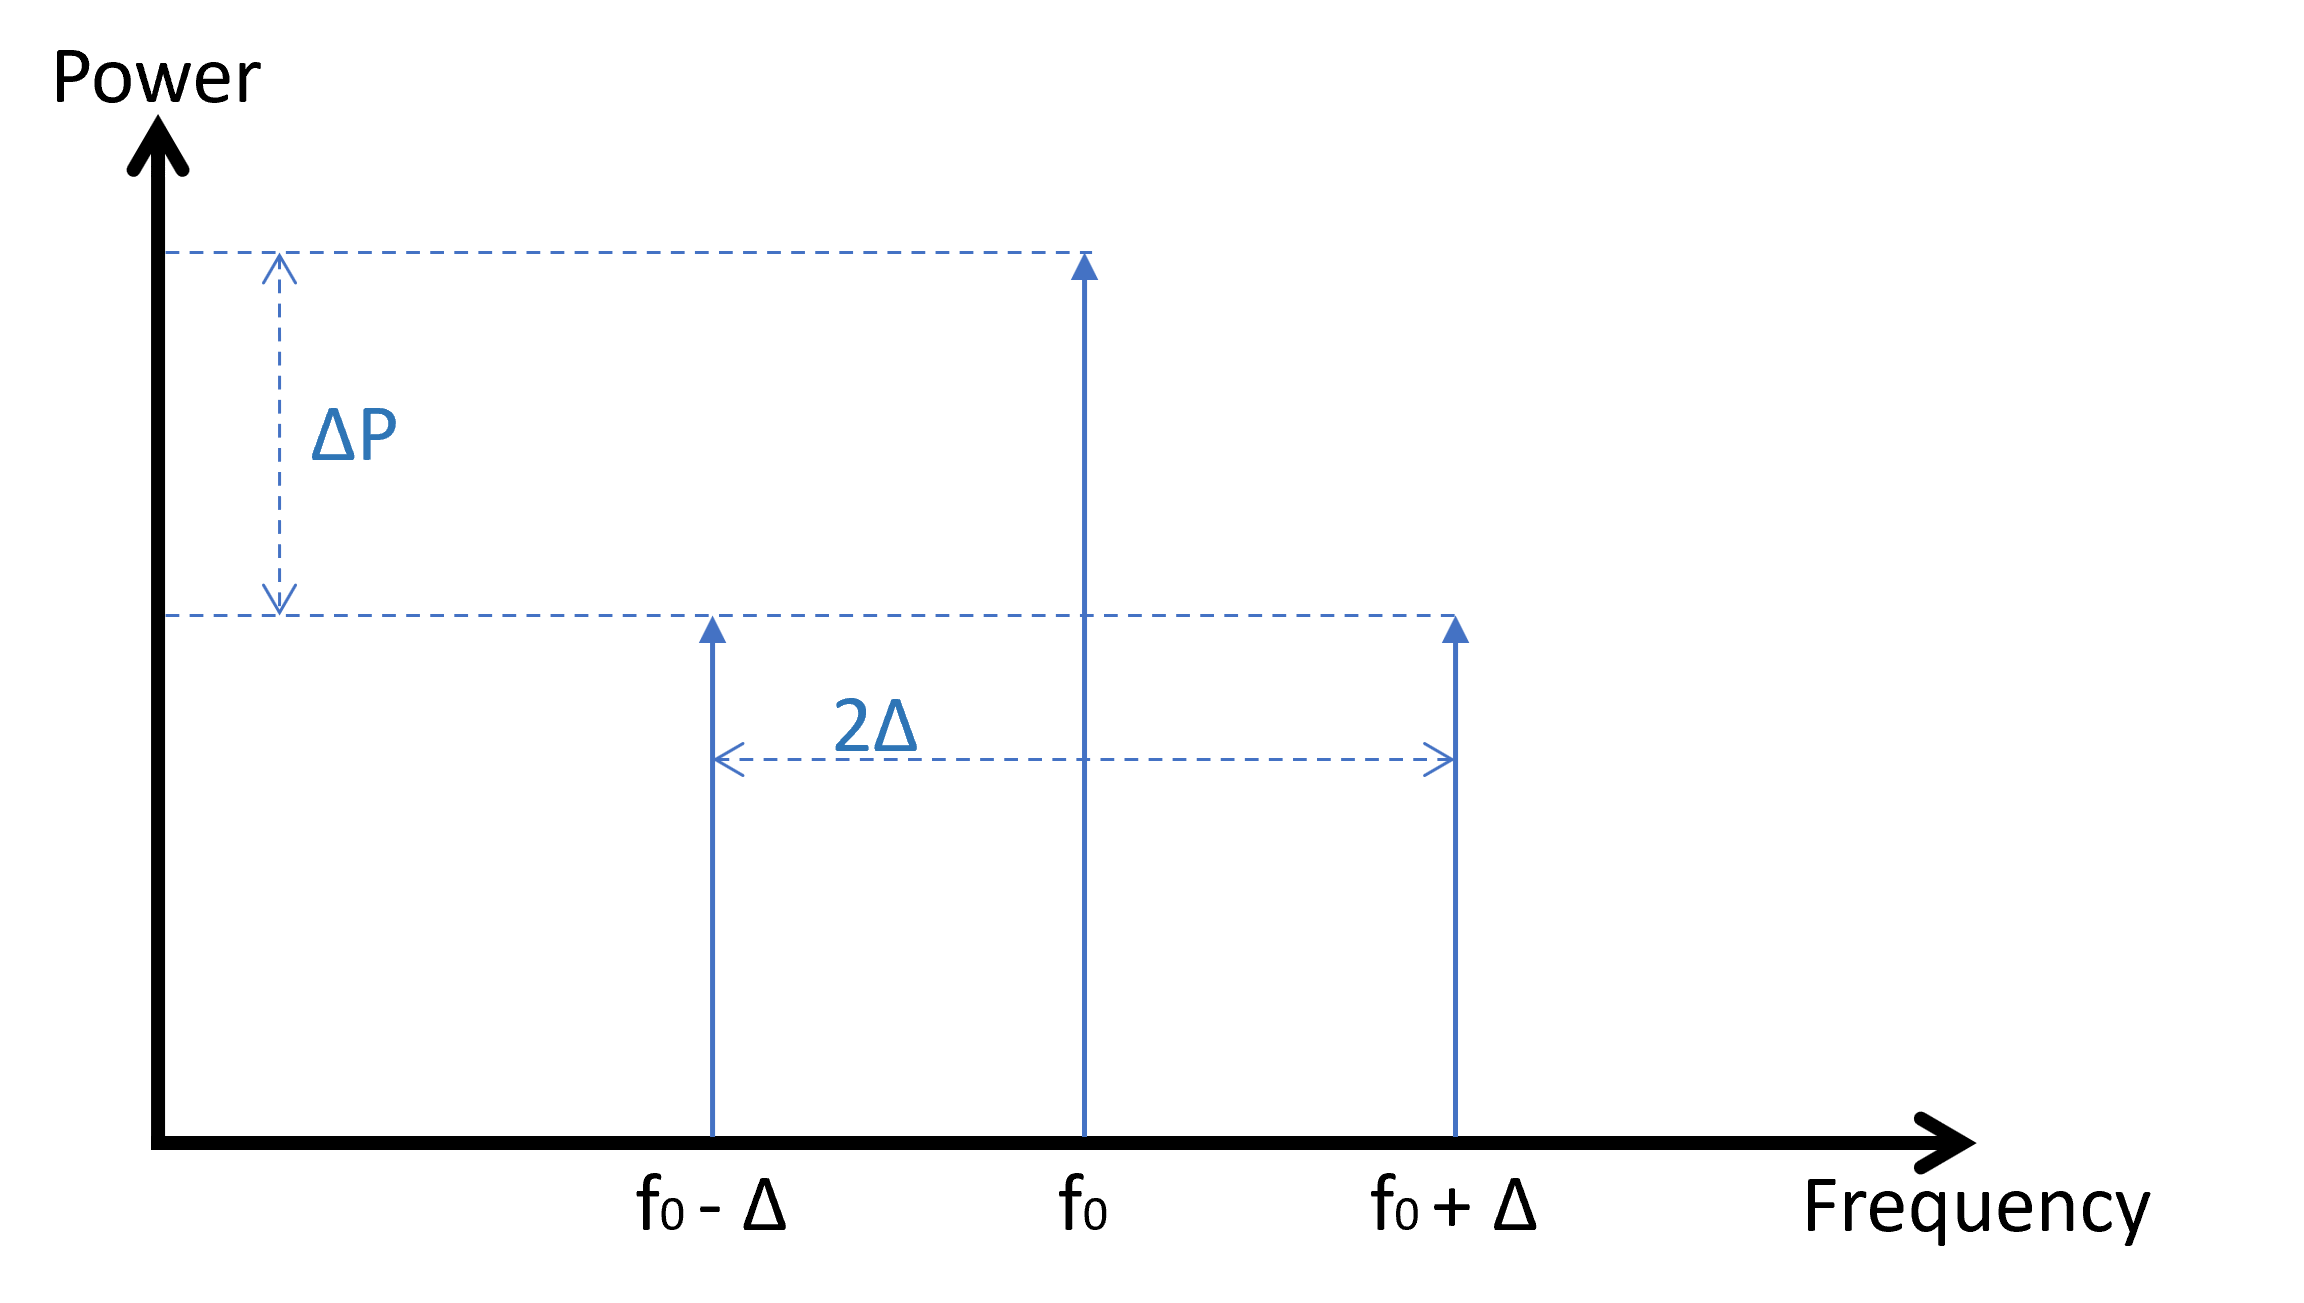
Graph configuration: the only difference with 1-Tone Real-Time Measurement Display is the data available in the
graph at three levels. As the 3-Tones measurement simply consists of three 1-Tone
measurement (one for each tone), the data is stored in three levels : fc - delta, fc and
fc + delta.
Note: Delta is available as a data in every level, representing the spacing
between the center frequency and the delta tones.
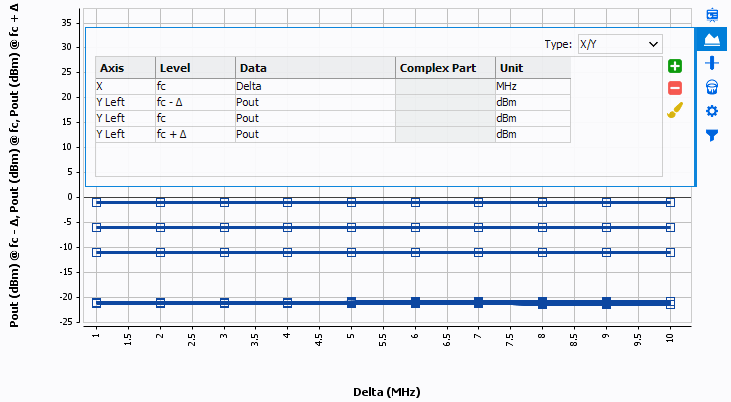
To configure the real-time graph viewer, select the correct frequency level (acquisition frequency) and then the data to visualize.
Here is an example with a central power sweep
list equal to {-10; -5; 0} dBm, a delta sweep list from 1 to 10 MHz with 1 MHz
step and with the delta tones power fixed to -20 dBm.
Note: It is possible to filter the curves by initial phase, either 90 or 270°, which is
specific to the 3-Tones measurement (orthogonal phases).