
Getting Started : "Optimize IQ & DPD Measurement Speed"
The competitive market of Power Amplifiers for 5G networks imposes rigorous specifications that need to be considered during the measurements phase. The setup should allow a full characterization using realistic signals (as LTE, 5GNR …) and evaluate the degree of linearization that the Power amplifier can achieve. Customers impose their criteria; therefore, the application engineer should run the measurements in different conditions to support the end-user. Time spent in front of the instrument to get all these measurements can be quite long.
This document presents how to optimize IQ & DPD measurements speed using IQSTAR.
Context
Usually, signals used to evaluate DPD are standardized through test-model signals, such as E-TM1.1 for LTE. This signal standardization leads to predefined waveforms, usually long (e.g: 10 msec). Depending on signal bandwidth, the total number of samples of these test models is large. (e.g: more than 1 million samples for 5G NR 100MHz).
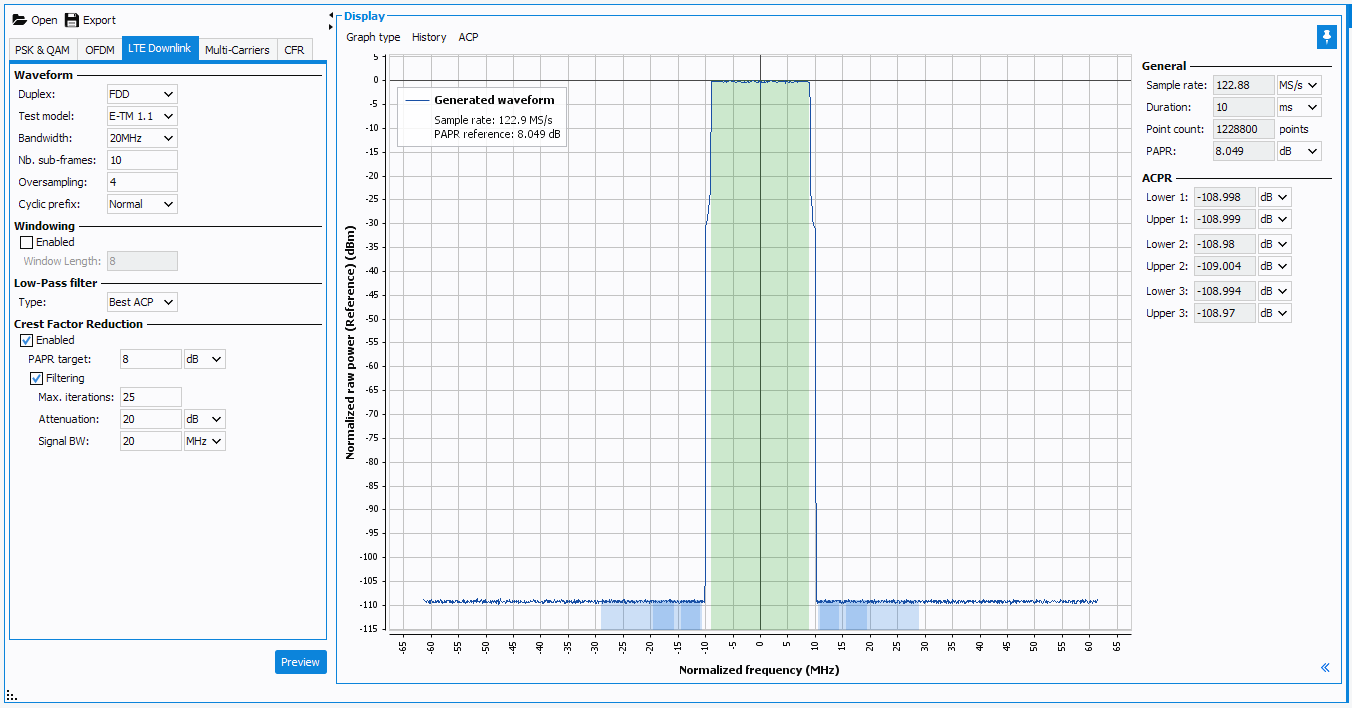
This article aims to present all the parameters related to measurement configuration and provide some tips to reach the best trade-off between measurement speed and results accuracy. The following Test Model signal (using IQSTAR LTE Downlink tool) is used for this investigation :
- LTE Downlink :
- BW = 20 MHz
- Test Model : E-TM 1.1
- Duplexing mode : FDD
- 1 Frames = 10 Sub-frames
- Cyclic Prefix : "Normal"
- Oversampling = 4
- Resulting a total of 1228800 samples
Several parameters and tips are investigated in this document to evaluate the measurement time cost as:
- Instruments remote connexion type (LAN, USB, GPIB, …) and analysis.
- Optimization of the number of samples transferred between the computer and the instruments.
- DPD methods and parameters optimizations
- Data processing and display optimizations
Instruments remote connexion
First, measurement speed depends on the remote connexion setup used between the computer, the RF Source and Vector Signal Analyzer.
In the case of the DPD application, there are at least 2 measurements made for each power level (one without DPD and one with DPD). IQSTAR does 2 downloads and 2 uploads of the waveform between the computer and the instruments. Therefore, the choice of instruments remote connexion becomes decisive to improve measurement speed.
Several remote connexions are available:
- GPIB : Theoretical data rate = 8 Mbit/s
- USB 2.0 : Theoretical data rate = 480 MBit/s
- LAN : Theoretical data rate = 100Gbit/s (depending on the LAN switch used). In reality, it also depends on PC network card, typically a 1Gbit/s is commonly used.
- PCI-Express : Theoretical data rate > 40Gbit/s depending on PCIe generation
Shown below are the measurement time results through different types of remote connections using the same test sequence, same test model signal, and set up conditions.
The best connexion is PCI Express, but it is rarely available on every setup. Thus, LAN connexion is the best compromise to optimize data transfer.
Optimize signal oversampling / number of subframes
As described above, the data transfer is the main contributor to the measurement speed. In DPD application, the number of waveforms transferred can be large depending on the number of iterations. Reducing the number of samples in the signal can be a key point to optimize the data transfer time. Multiple parameters can be changed, such as the oversampling of the signal or the number of subframes when using LTE Downlink to reduce the total number of samples.
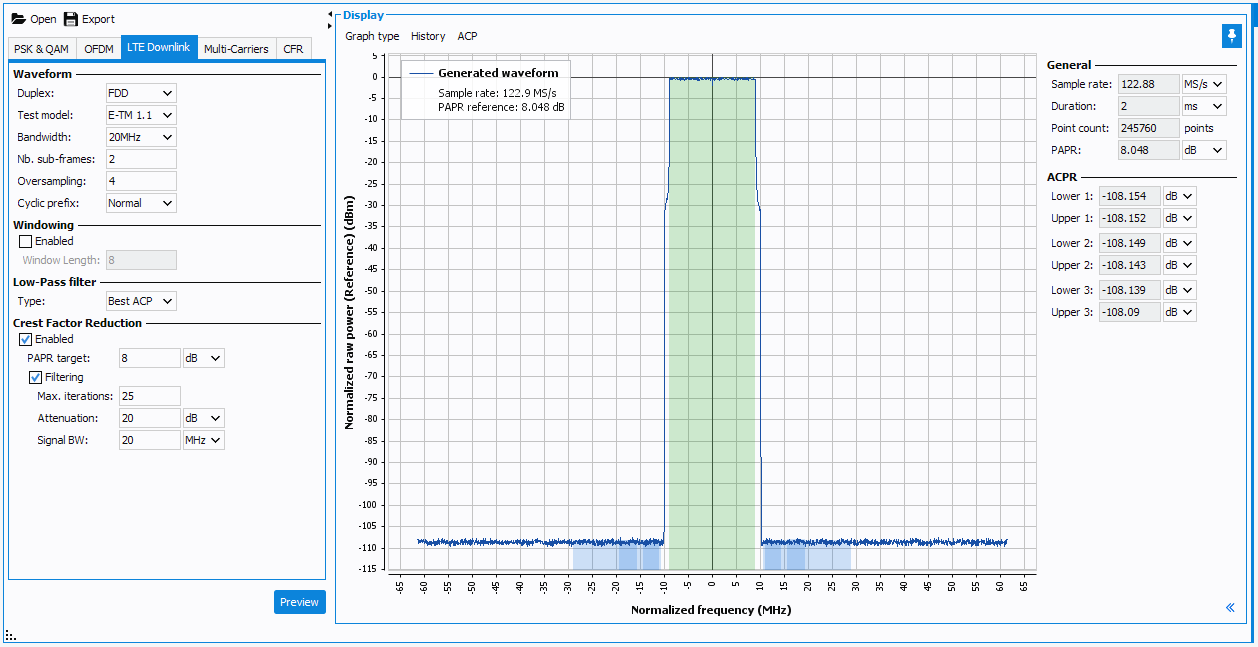
Unfortunately, in DPD application, the oversampling needs to be at least 4 to ensure DPD efficiency and measure ACPR; therefore, this parameter is not easy to adjust. So the last parameter to change is the number of subframes of the test model signal. Usually, the number of subframes is 10. As shown previously, with 10 subframes, the waveform points number is very large, more than one million, assuming a 4 oversampling ratio. When the number of subframes decreases, the number of samples in the signal also decreases without damaging the signal's quality. Still, there are limitations in the minimal number of subframes because the waveform won't be reliable if it is too small.
As shown under CCDF curves, with 3 subframes (respectively 2, 5 10), the resultant CCDF isn't affected.
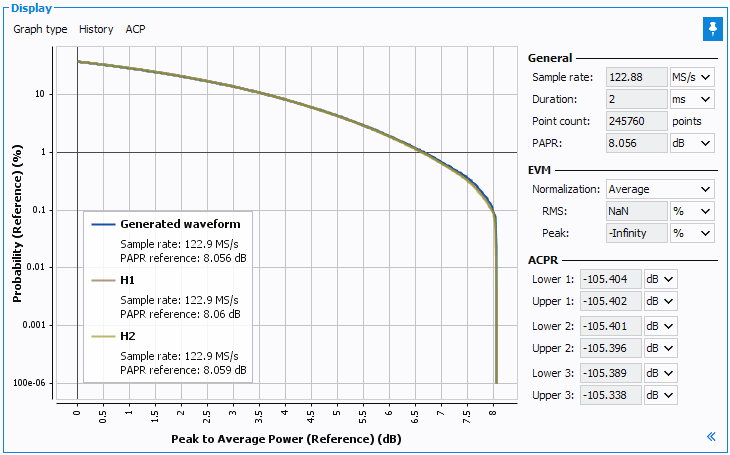
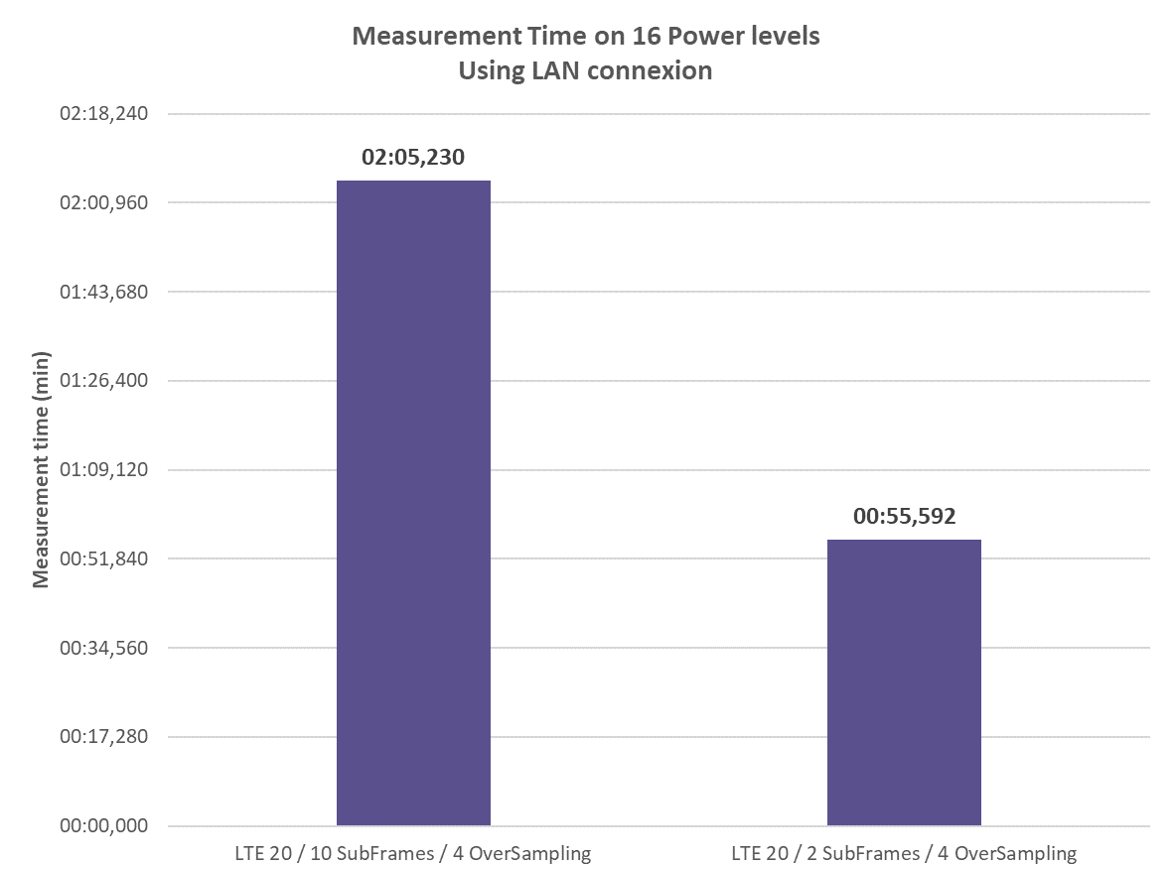
In this example, the best setting to decrease the number of waveform points is 2 Subframes. So the number of points decreases by a factor of 5 from 1,228,800 to 245,760 points.
In this configuration, the time saved during measurements is around 50%, as shown below, comparing the time to perform a sweep of 16 power levels with the original signal (more than 1 million samples) and the adjusted signal (only 245k samples).
Measure and analysis of a representative slice of the waveform
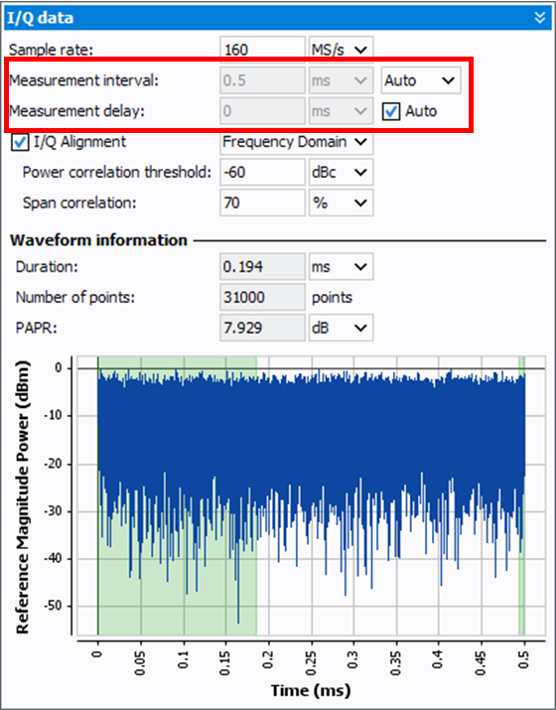
The software uses only a waveform slice to measure and analyze to improve measurement speed. Selecting the appropriate slice representing the original waveform's statistical characteristics makes it possible to find a tradeoff between measurement accuracy and speed. IQSTAR allows the selection of the waveform slice to be measured, using "measurement interval" and "measurement delay", and analyzed. Only this slice is fetched from this instrument.
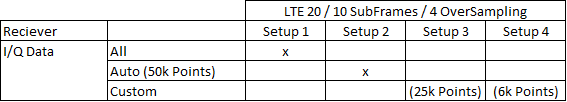
- Setup 1 : Original waveform
- Setup 2 : Slice auto-adjusted by IQSTAR (50k samples)
- Setup 3 : Slice selected by user with 25k samples
- Setup 4 : Slice selected by user with 6k samples
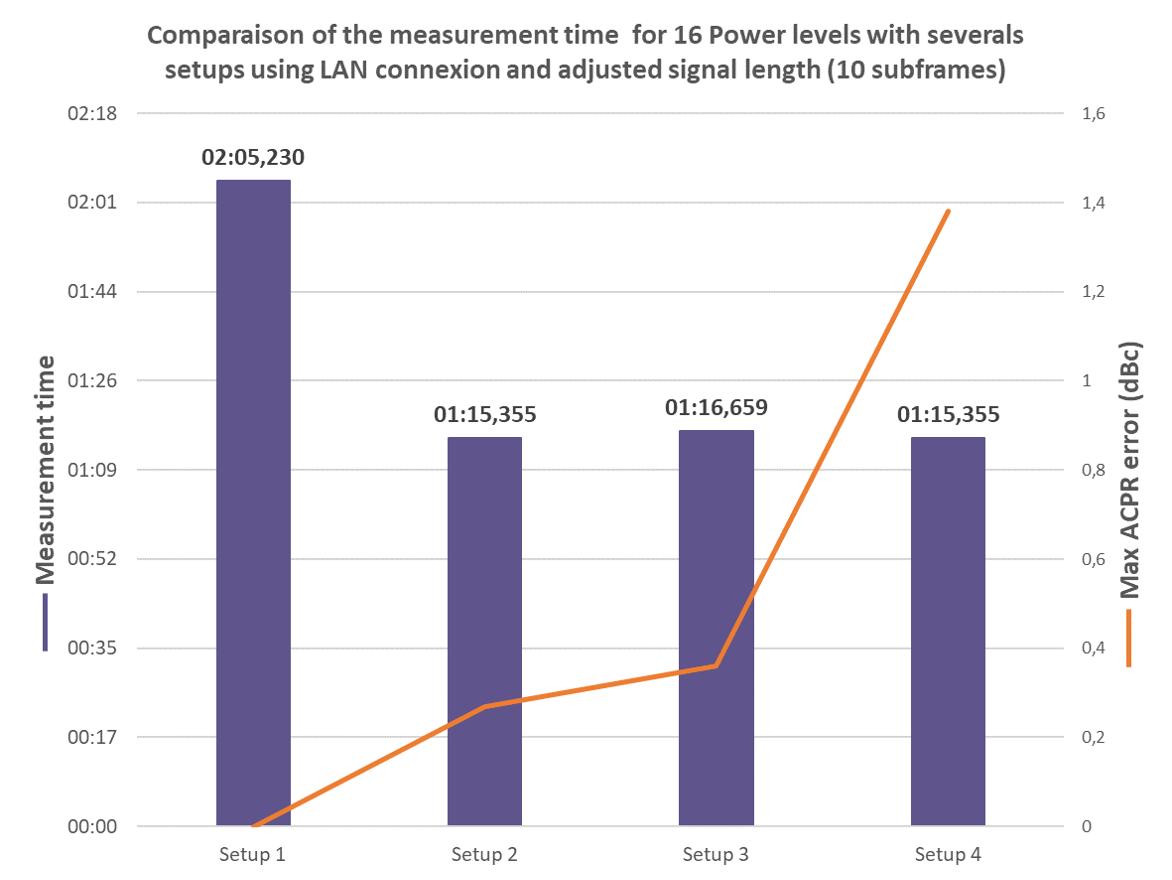
As we can see on the graph above, the measurement time becomes constant independently from reducing the number of samples because the data transfer time becomes negligible. Moreover, the data's accuracy worsens when the number of samples in the measured and analyzed signal is too small. As an example, the resultant ACPR error increases significantly, as shown above with Setup 4 (max ACPR error > 1.3 dBc).
In conclusion, the automatic waveform slice selection, done by IQSTAR (50k samples), allows improving the measurement speed by around 45% while introducing a maximum ACPR error of 0.3 dBc.
DPD optimization
In DPD application, there are at least 2 measurements made for each power level (one without DPD and one with DPD). IQSTAR does 2 downloads and 2 uploads of the waveform between the computer and the instruments. Therefore, data transfer optimization is a key factor (Instruments remote connexion, Optimize signal oversampling / number of subframes,Measure and analysis of a representative slice of the waveform).
Moreover, DPD computing requests large memory capabilities due to the lead square method to solve model coefficients. Therefore, the calculation of the DPD is closely linked to the computer capability.
Finally, the degree level of the DPD function (Memory Less, Memory Polynomial, Generalized Memory Polynomial) and the DPD training length directly impacts the calculation time of the coefficients (Pinv function) .
- Using IQSTAR capabilities, a benchmark of DPD computation time with several training lengths have been investigated:
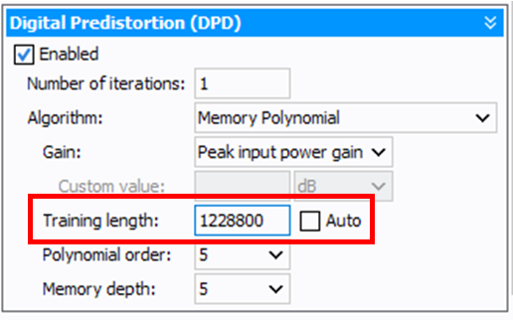
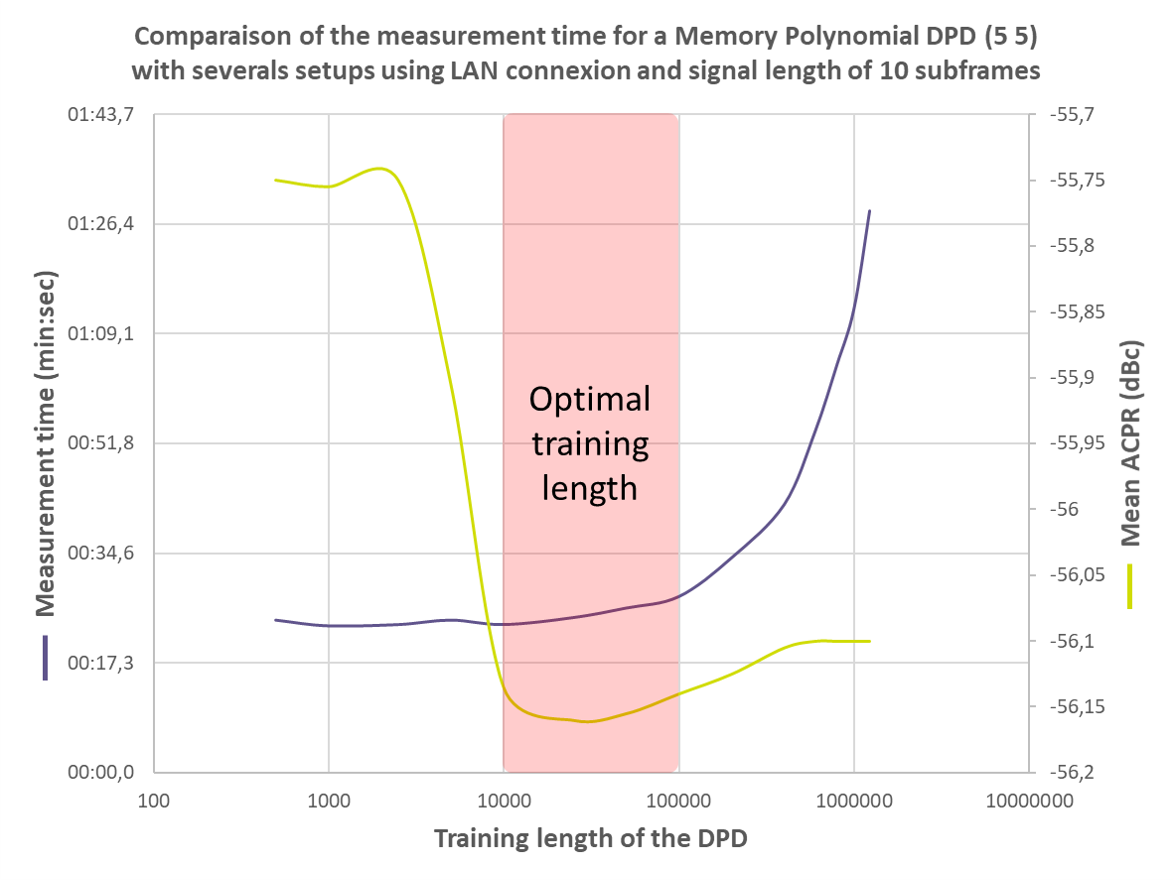
In this example, we use the LTE 20 signal with 10 subframes, the optimal training length where the trade-off between measurement time and DPD efficiency is around 50k samples—using the full-size waveform (1228800 samples) as training length is not a good option in terms of measurement time. On the other hand, decreasing the training length considerably leads to deterioration in DPD efficiency without improving measurement speed.
-
The choice of the DPD algorithm must also be appropriate for the DUT and test model used. Below a benchmark on measurement time cost versus DPD algorithm complexity has been done using Memory Polynomial models more or less complex.
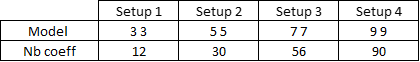
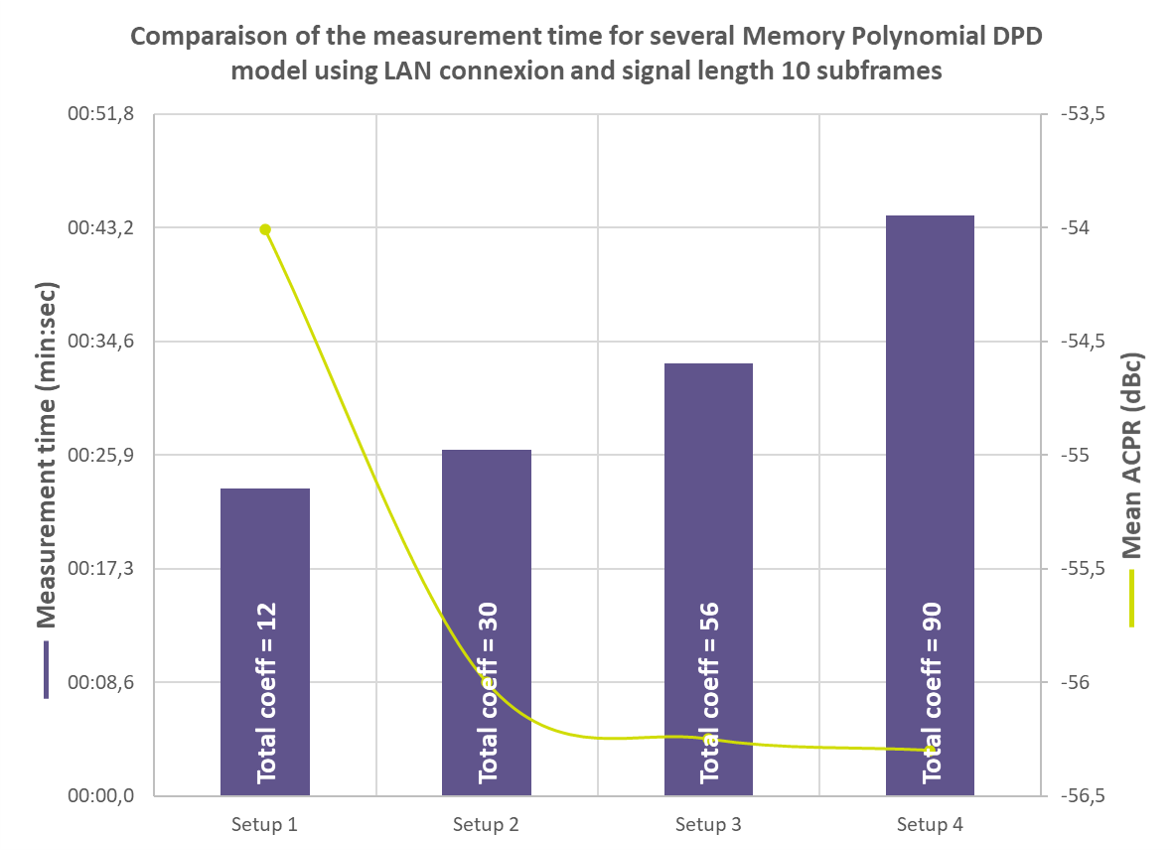
In this case, LTE 20MHz with 10 Subframes signal is used. We can see that above 30 coefficients (K=5 and M=5), the ACPR results are not improving and measurement speed decreases. Therefore, the best Memory Polynomial structure to use in this case is K = 5 and M = 5.
Computer's memory resources optimization
Depending on the computer's performance, data display can contribute to the measurement time cost. Several IQSTAR options can be used to improve this data display resources
- CCDF Trace display disable
 Note: "Trace display" option allows displaying CCDF trace during measurement. It's highly recommended to disable it to improve measurement time. Even if the CCDF trace display is disabled, the CCDF is automatically computed in the post-measurement (whiteboard, Viewers).
 - AM/AM Display optimization: Put "Display point" in Auto and disable
color gradient
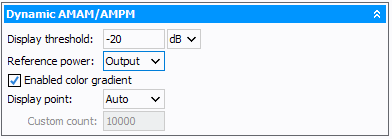 Note: Enabled color gradient : allows to apply gradient density coloration on AM/AM & AM/PM traces (can slow down measurement)Note: Display point : Select "Auto", "All" or "Custom" to limit number of point displayed or improve display speed depending on the waveform size.
Below is the comparison of measurement time with and without data display tips optimization, using LTE 20MHz, 10 Subframes signal.

Conclusion
Several options are available to optimize DPD measurements:
- Optimize the connexion between the computer and the instruments (LAN is highly recommneded)
- Optimize the number of samples of the test model signal (LTE Downlink) (4 Oversampling at least for DPD)
- Optimize the number of samples fetched from the instruments with the I/Q Measurement Panel: Receiver Settings
- Optimize the DPD training length and DPD structure complexity
-
Reduce unnecessary computer's memory allocation by disabling all the displays options
In this study, an original approach using the full waveform size in DPD application leads to 1:28 minutes to evaluate one power level with Memory Polynomial K = 5 M = 5. Combining all tips described in this document, the final measurement time achieved is 13 seconds for the same power level and DPD complexity, resulting in the same ACPRs results.