
Perform LoadPull Simulation
To perform a Load Pull simulation, the "IDEAL TUNER" block(See Ideal Tuner) generates a file with a pattern of impedances, which can be added to "ERHO" block at the end of the schematic. The impedance is then swept using the VAR block, which varies the index of the impedance in the file created by the ideal tuner. The load can be defined in either magnitude and phase format or real and imaginary format...
To begin this task, you will need:
- A licence of VISION System Architect. See Installation and licence setup.
The basic steps to perform a LoadPull simulation are:
-
Choose the template schematic palette. Drag and drop the LoadPull block
from the palette window to the schematic window.
Figure: LoadPull template schematic 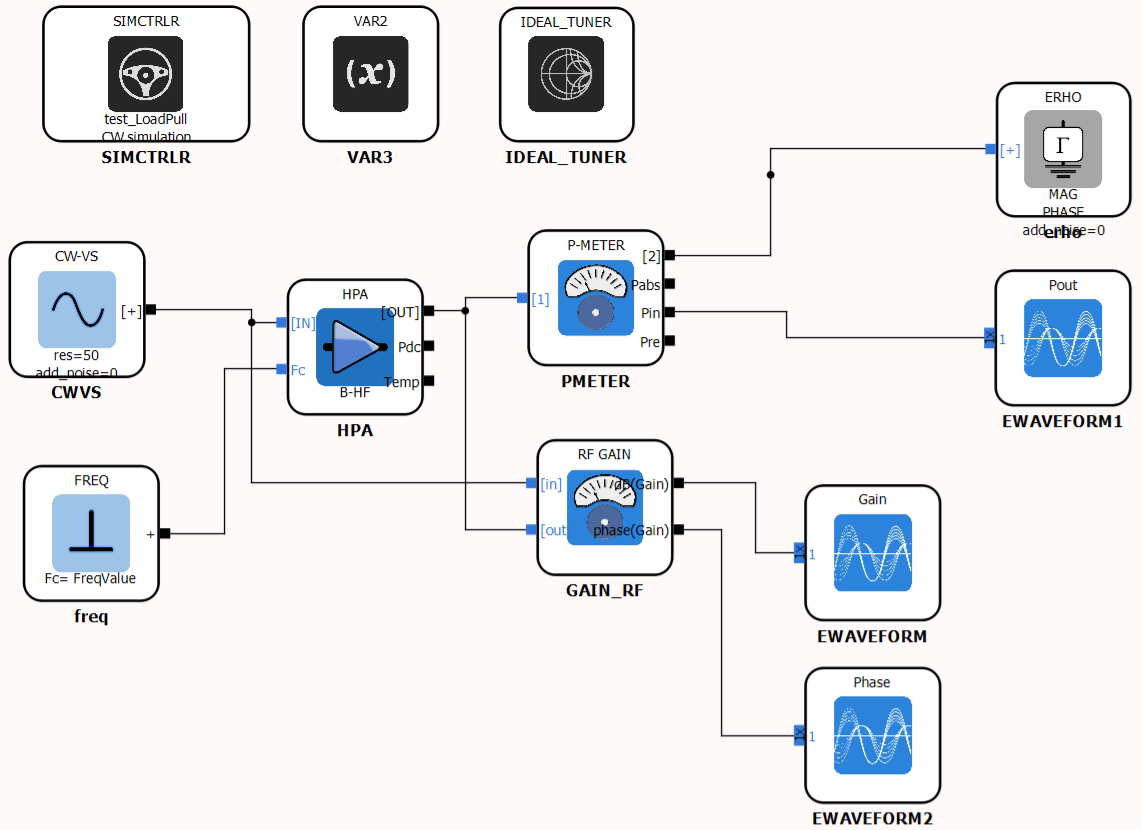
-
Double-click on the IDEAL_TUNER block to open the parameter window to visualize
the already created impedance pattern :
- disable the option " Enable preview" to visualize the created pattern in
red ( the number of impedances created is 37).
Figure: Parameters block 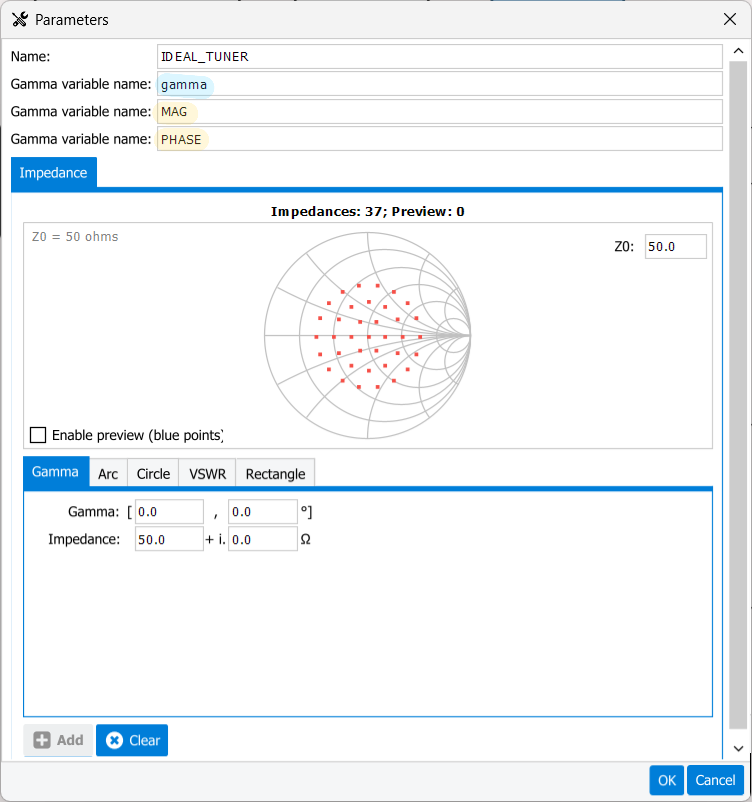
- if we want to add other impedances, the preview should be enabled then the pattern chosen and added to the file using the " +Add" button.
Figure: Parameters block 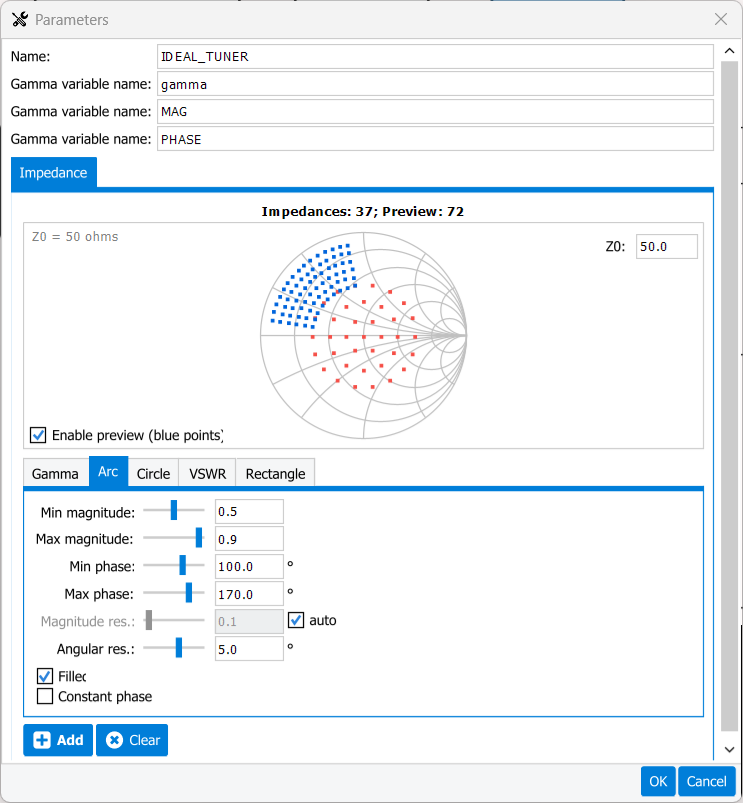
- disable the option " Enable preview" to visualize the created pattern in
red ( the number of impedances created is 37).
-
The indexes to the impedances are swept in the variable bloc.
Figure: Variable block 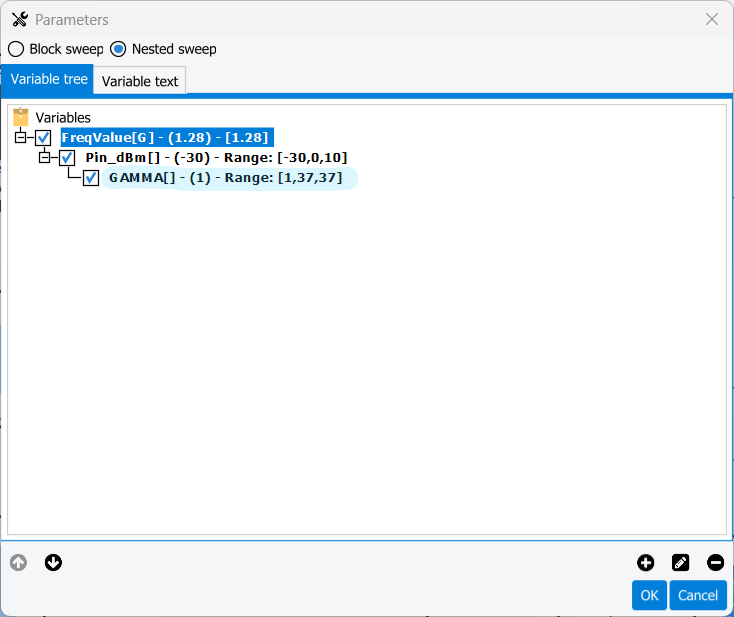
-
To sweep the impedances at the output of the HPA, we will insert the variables
for the phase and magnitude of the impedance into the ERHO block.
Figure: Parameters block 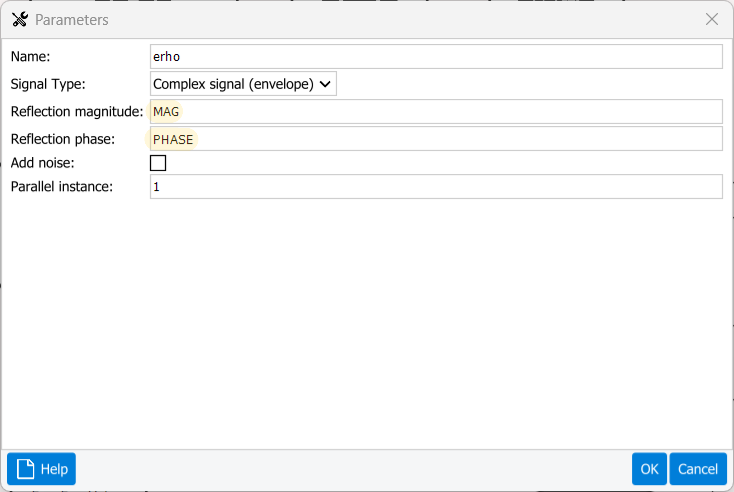
-
After launching the simulation, the corresponding graph can be viewed directly
in the Output Graphs tab.
Figure: Output graphs 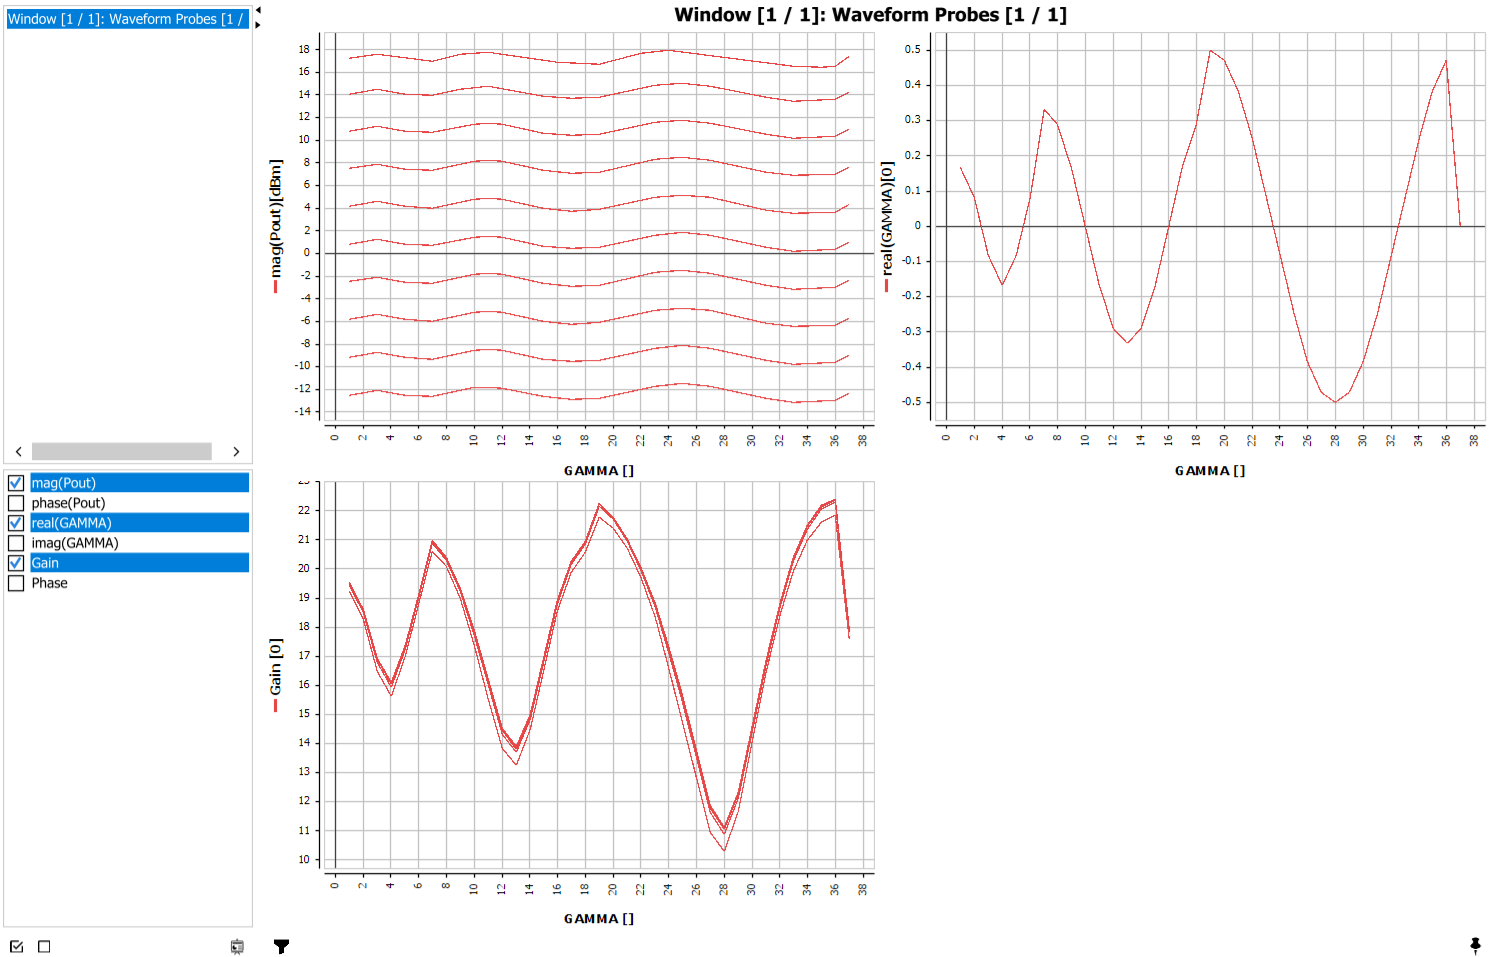
To visualize these parameters as contours in the smith chart. It is possible to do so in the WHITEBOARD:
- slide the ".imx" of the LoadPull simulation into the
datasources
Figure: Output graphs 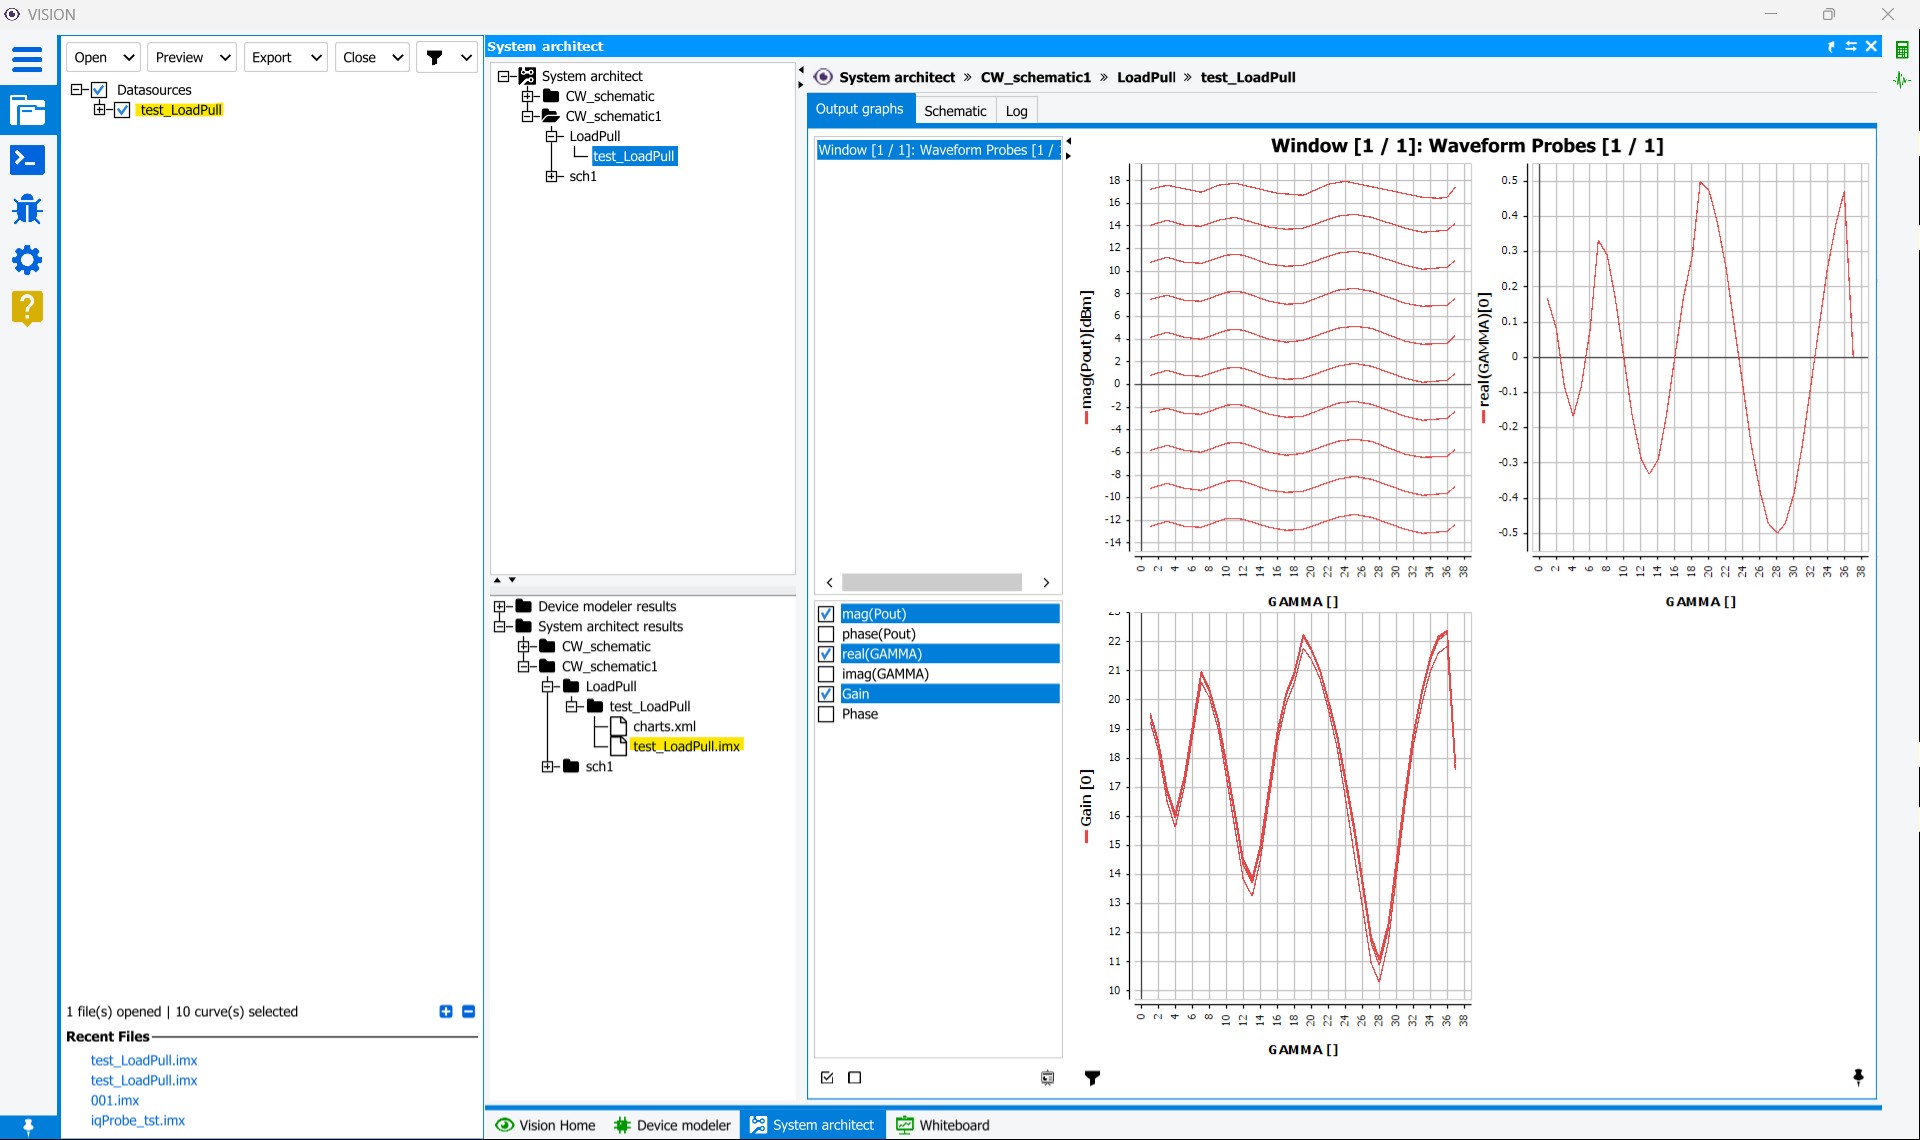
- Create a new page in the WHITEBOARD and add a filter as well as a graphic
- Choose the input power "PIN_DBM" as the filter variable
Figure: WHITEBOARD 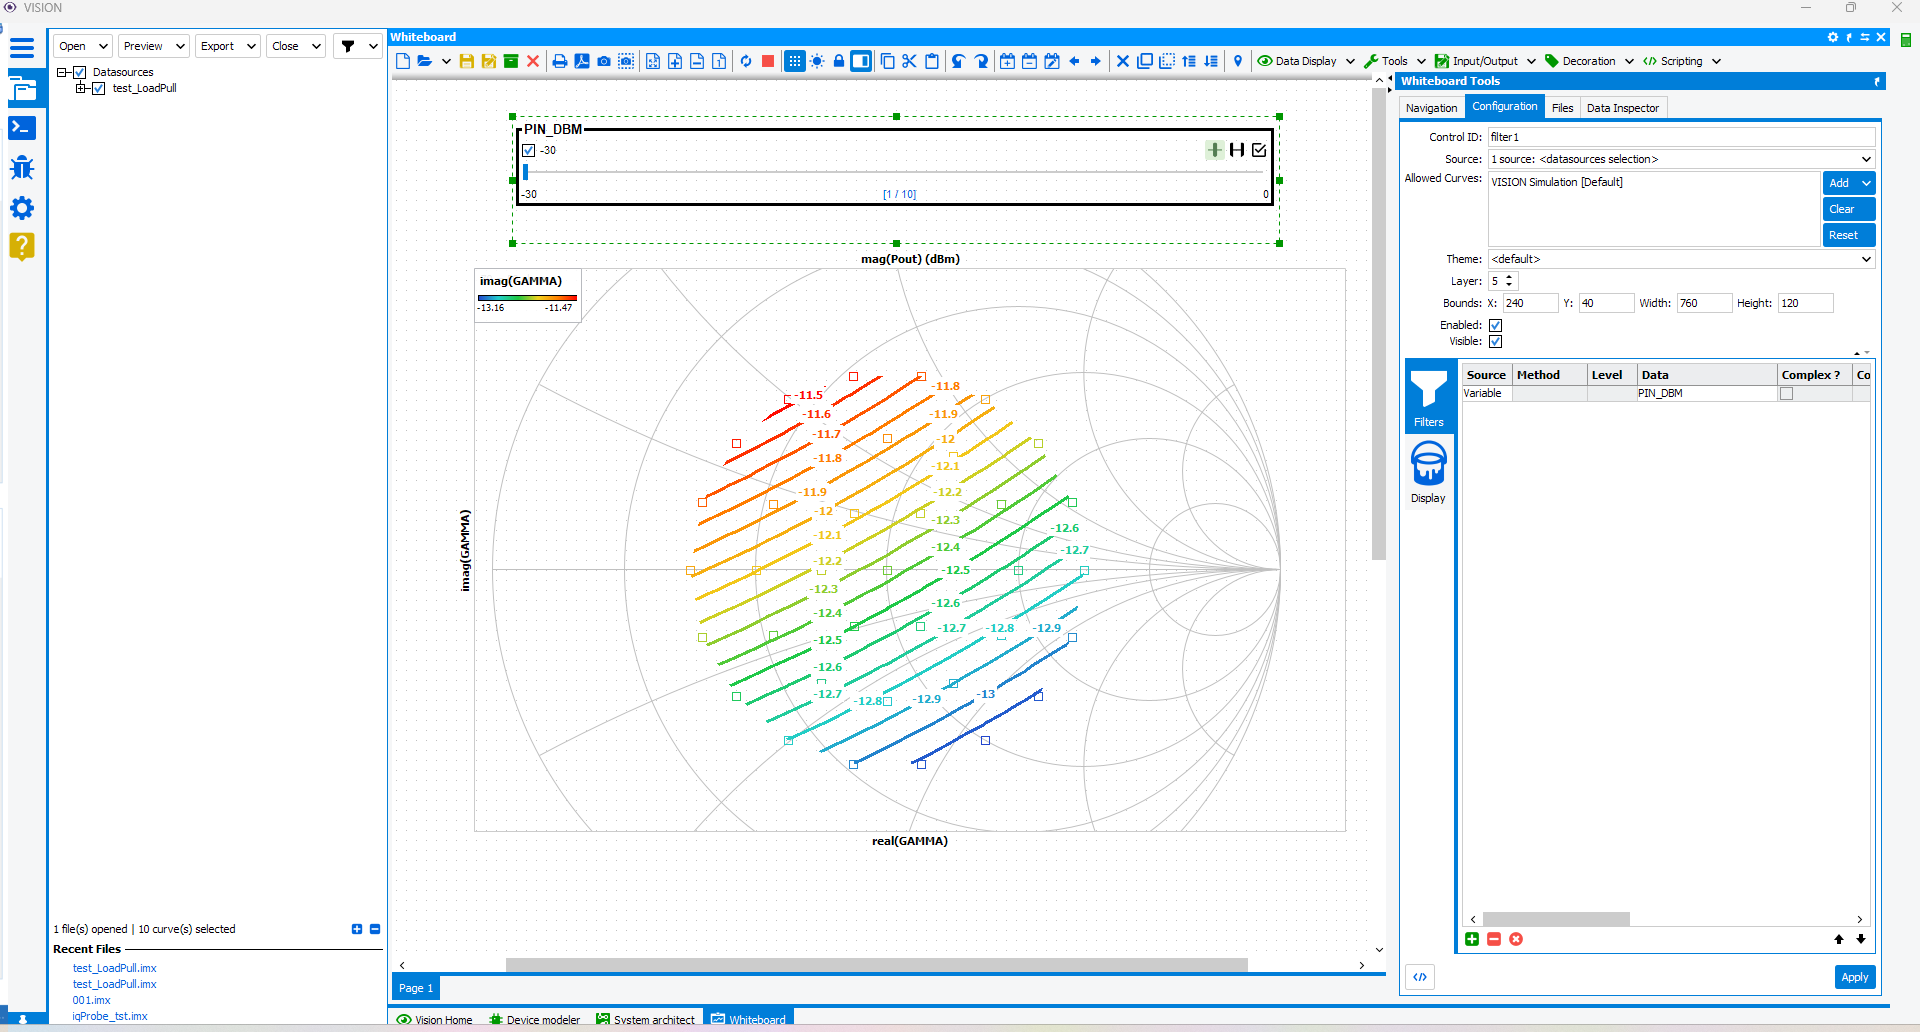
- For the graphic, select Contours as the display
mode and Z Smith Chart as the graph type. Set the
data display with real(GAMMA) on the X-axis, imag(GAMMA)
on the Y-axis, and mag(Pout) on the Z-axis.
Figure: WHITEBOARD 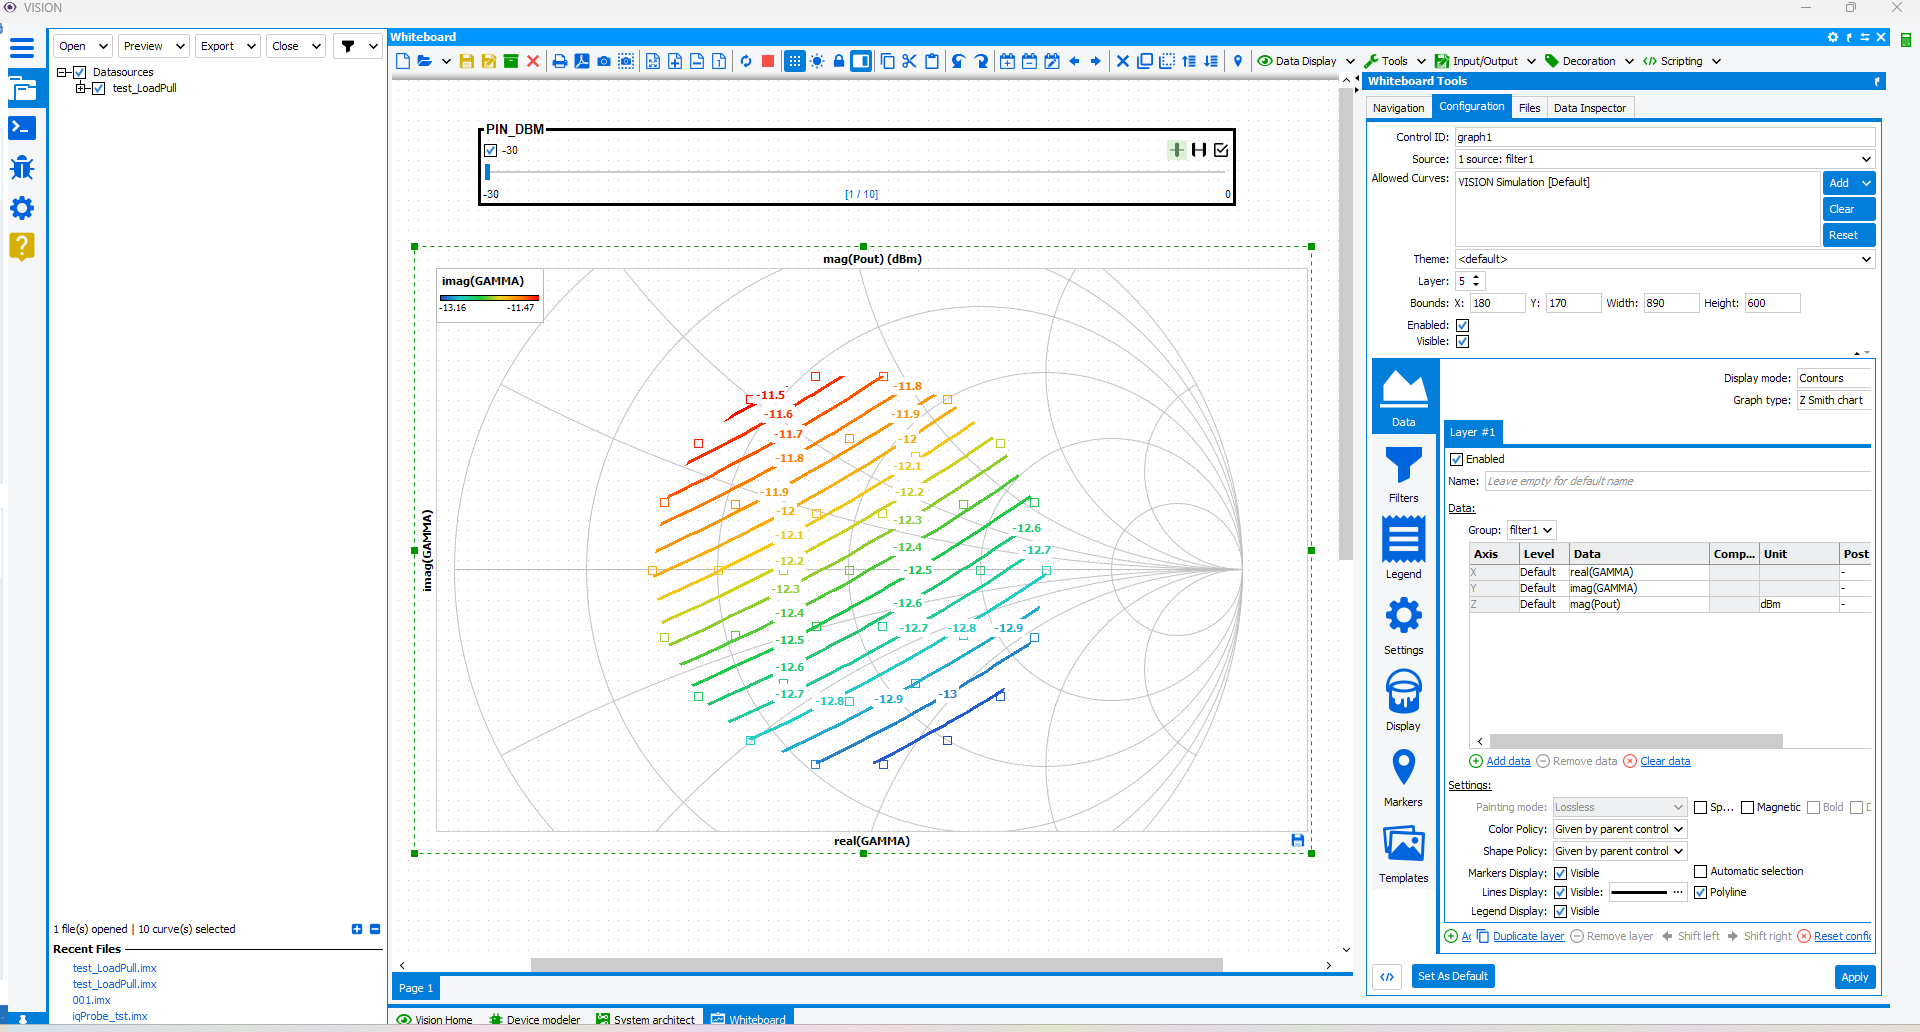
- slide the ".imx" of the LoadPull simulation into the
datasources