
Stacker
Overview
The ( ) icon allows to insert a
'stacker' control on the workspace. 'Stacker' control allows to stack multiple
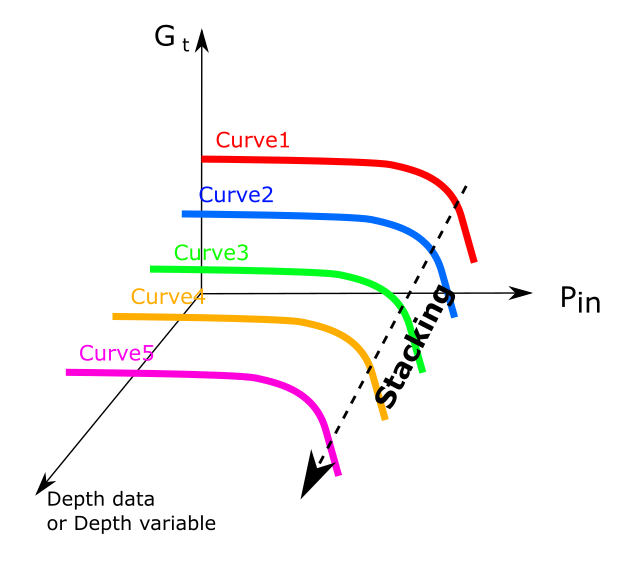
curves on a specific data or variable (frequency, temperature, quiescent voltage
...) in order to plot 3D graph (e.g.: Plot DUT specifications over the frequency
in 3D).
) icon allows to insert a
'stacker' control on the workspace. 'Stacker' control allows to stack multiple
curves on a specific data or variable (frequency, temperature, quiescent voltage
...) in order to plot 3D graph (e.g.: Plot DUT specifications over the frequency
in 3D).
Click on the () icon then anywhere in
the workspace, drag the mouse to delimit the stacker.
) icon allows to insert a
'stacker' control on the workspace. 'Stacker' control allows to stack multiple
curves on a specific data or variable (frequency, temperature, quiescent voltage
...) in order to plot 3D graph (e.g.: Plot DUT specifications over the frequency
in 3D). Click on the (
) icon then anywhere in
the workspace, drag the mouse to delimit the stacker.Tip: Stacker control is an invisible control. Select the 'Highlight control'
( ) to
highlight the edge of the stacker.
) to
highlight the edge of the stacker.
) to
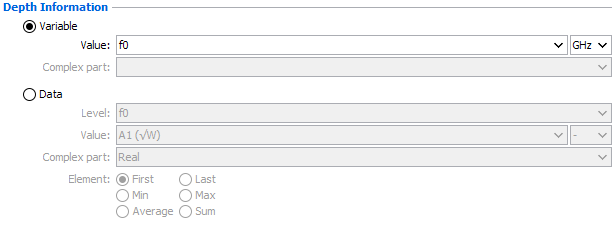
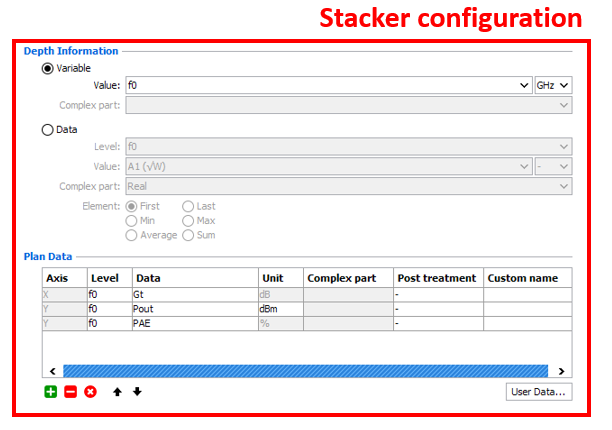
highlight the edge of the stacker.Depth Information
Depth information configuration allows to define the stacking variable or data.
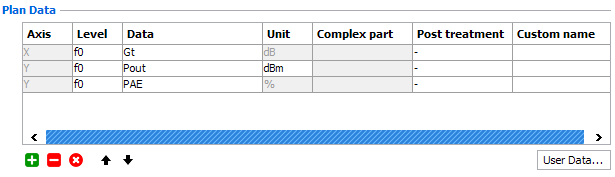
Plan Data
The plan data configuration allows to define the variable or data to stack.
Example
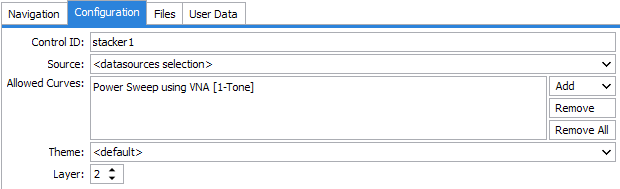
Define the 'Allowed Curves' of
the stacker corresponding to the curve type to extract.
Once the 'Stacker' has been inserted, select 'f0' as 'Depth data'. Then select the data ('PAE', 'Pout' and 'Gt') to stack in the plan data.
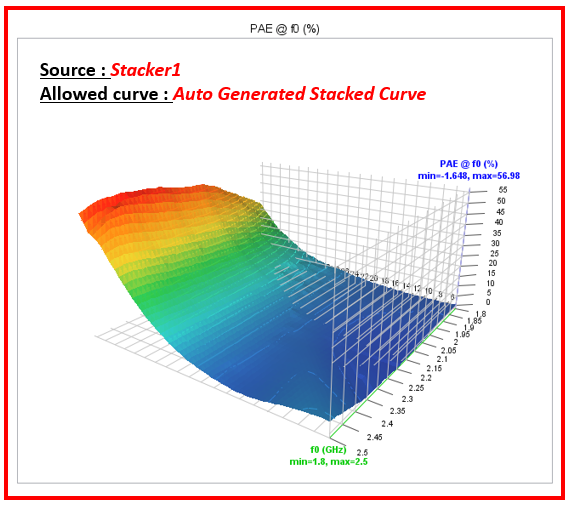
Once the 'Stacker' has been set, insert a new Graph to link each others. Then set the 'Source' of the graph on 'Stacker1'. The 'Allowed curves' will be automatically set to 'Auto Generated Stacked Curve' as IQSTAR will create a new 3D interpolated curve. Then set the graph in 3D mode (To learn more see Graph Mode).
Once the 'Stacker' has been inserted, select 'f0' as 'Depth data'. Then select the data ('PAE', 'Pout' and 'Gt') to stack in the plan data.
Once the 'Stacker' has been set, insert a new Graph to link each others. Then set the 'Source' of the graph on 'Stacker1'. The 'Allowed curves' will be automatically set to 'Auto Generated Stacked Curve' as IQSTAR will create a new 3D interpolated curve. Then set the graph in 3D mode (To learn more see Graph Mode).