Extractor
Overview
The (![]() ) icon allows to insert an
'extractor' control in the workspace. 'Extractor' control allows to extract curves
values at specific conditions (Pout level, Pin level, Gain compression, ACPR level
...) through interpolation process. (e.g.: Plot DUT specifications (Pout,
Efficiency, Gt) over the frequency at 3dB of gain compression).
) icon allows to insert an
'extractor' control in the workspace. 'Extractor' control allows to extract curves
values at specific conditions (Pout level, Pin level, Gain compression, ACPR level
...) through interpolation process. (e.g.: Plot DUT specifications (Pout,
Efficiency, Gt) over the frequency at 3dB of gain compression).

 Input Data
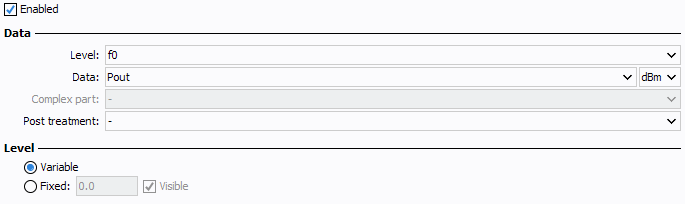
The control data configuration allows to define specific data and level of extraction.
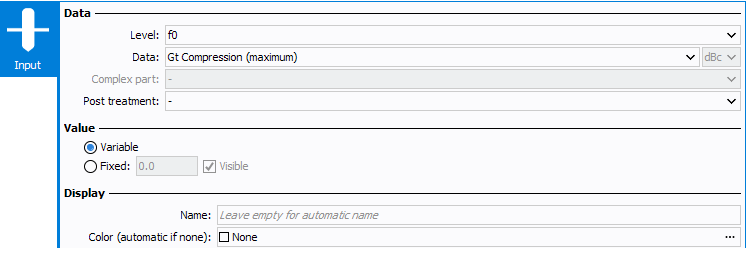
- Level: select the frequency level corresponding to the data to
display. Note: The level setting is done to sort the data when harmonics (Level : f0, 2.f0, 3.f0 ...) or 2-tones (Level : 2.f2-f1, f1, f2, 2.f1-f2 ...) measurements analysis are required.
- Data: select the data used as extraction condition Note: The data list depends on the *.imx file loaded in the 'Datasource, on the 'Allowed curves' defined and on the 'Level' selected. The data list is sorted by alphabetical order.
- Complex Part: select the complex part corresponding to the data to display when this one is a complex number (A1,B1,A2,B2, Zin, Zload, ...)
- Post treatment: allows to invert the sign of the data to display
- Value: select 'Variable' to display a slider or 'Fixed' to define a fix value and disable the slider
- Display: define a custom name if needed (it will overwrite the current one) and choose its font color
 Output Splitting
Depending of the number of files
imported or the source selected (filter, selector graph ...), the number of output
curves can be large, defining output splitting rules, it's possible the group/sort
curves by variables (Biasing, Frequency, Temperature, ….), Names (Curve name, Dataset
Name, Datasource Name, ….), Data (First Pin, Mean Pin, Max Pin …). Use ( ) and (
 ) icons to handle the output
splitting list.
) icons to handle the output
splitting list.
- Source: select if the parameter is a variable or data
- Method: select the method of selection ('Interpolation', 'Minimum', 'Maximum', 'First', 'Last', 'Average', 'Sum')
- Level: select the frequency level corresponding to the data to
displayNote: The level setting is done to sort the data when harmonics (Level : f0, 2.f0, 3.f0 ...) or 2-tones (Level : 2.f2-f1, f1, f2, 2.f1-f2 ...) measurements analysis are required.
- Data: select the parameter to displayNote: The data list depends on the *.imx file loaded in the 'Datasource, on the 'Allowed curves' defined and on the 'Level' selected. The data list is sorted by alphabetical order.
- Complex: define if the data is a complex or not, if checked, unlocks the following parameter.
- Complex Part: select the complex part corresponding to the parameter to display when this one is a complex number (A1,B1,A2,B2, Zin, Zload, ...).
- Unit: select the unit of the parameter to displayNote: The unit list depends on the data selected.
- Post-treatment: allows to invert the sign
- Rounding: if a numerical data is used, defines the precision of the number of digits to compare (after the comma).
 Output
Data
Output
Data
Output data configuration allows to select the data or variable to extract. Use
() and () icons to handle the
extracted data list.
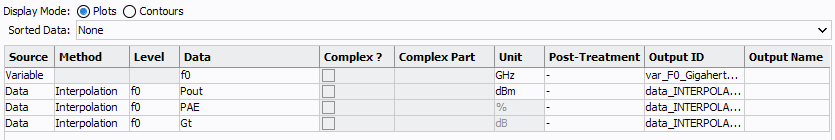
- Display Mode: select the curve type between 2D plot and 3D contours
-
Sorted Data: select the data used to sort the extracted data.
Basically, the sorted data correspond to the future X axis desired (e.g.:
Frequency) Note: Refer to Whiteboard Examples
- Source: select if the parameter is a variable or data
- Method: select the method of extraction ('Interpolation', 'Minimum', 'Maximum', 'First', 'Last', 'Average', 'Sum')
- Level: select the frequency level corresponding to the data to
displayNote: The level setting is done to sort the data when harmonics (Level : f0, 2.f0, 3.f0 ...) or 2-tones (Level : 2.f2-f1, f1, f2, 2.f1-f2 ...) measurements analysis are required.
- Data: select the parameter to displayNote: The data list depends on the *.imx file loaded in the 'Datasource, on the 'Allowed curves' defined and on the 'Level' selected. The data list is sorted by alphabetical order.
- Complex: define if the data is a complex or not, if checked, unlocks the following parameter.
- Complex Part: select the complex part corresponding to the parameter to display when this one is a complex number (A1,B1,A2,B2, Zin, Zload, ...).
- Unit: select the unit of the parameter to displayNote: The unit list depends on the data selected.
- Post-treatment: allows to invert the sign
- Output Name: choose a custom name
- Output ID: ID of the output curve, change to define a custom one
 Output
Variables
Output
Variables
Output variables configuration allows to define the variable associated to the
extracted curves. Use ()
and () icons to handle
the extracted variables list. This settings is usefull to forward legend conditions
or Filter curves.

- Source: select if the parameter is a variable or data
- Method: select the method of selection ('Interpolation', 'Minimum', 'Maximum', 'First', 'Last', 'Average', 'Sum')
- Level: select the frequency level corresponding to the data to
displayNote: The level setting is done to sort the data when harmonics (Level : f0, 2.f0, 3.f0 ...) or 2-tones (Level : 2.f2-f1, f1, f2, 2.f1-f2 ...) measurements analysis are required.
- Data: select the parameter to displayNote: The data list depends on the *.imx file loaded in the 'Datasource, on the 'Allowed curves' defined and on the 'Level' selected. The data list is sorted by alphabetical order.
- Complex: define if the data is a complex or not, if checked, unlocks the following parameter.
- Complex Part: select the complex part corresponding to the parameter to display when this one is a complex number (A1,B1,A2,B2, Zin, Zload, ...).
- Unit: select the unit of the parameter to displayNote: The unit list depends on the data selected.
- Post-treatment: allows to invert the sign
- Output Name: choose a custom name
- Output ID: ID of the output curve, change to define a custom one
- Rounding: if a numerical data is used, defines the precision of the number of digits to compare (after the comma).
 Back-Off
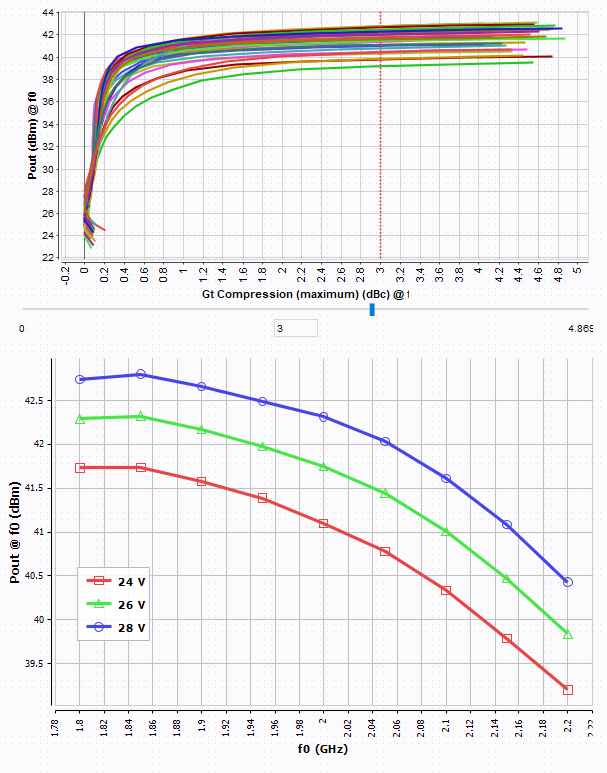
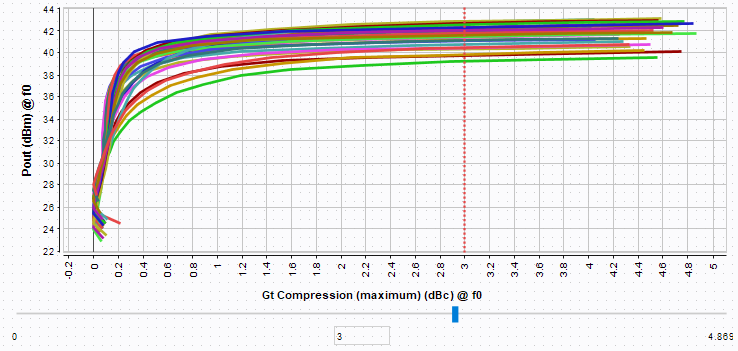
The example below shows an extraction in function of 'Gt compression' and a 'Pout' back-off extraction referenced at 3dB of 'Gt compression'.
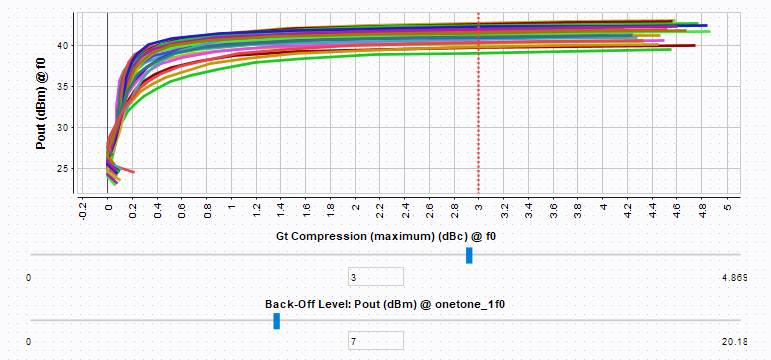
This data can be interpolated or extrapolated. Go to settings to enable or disable those methods.
 Preview
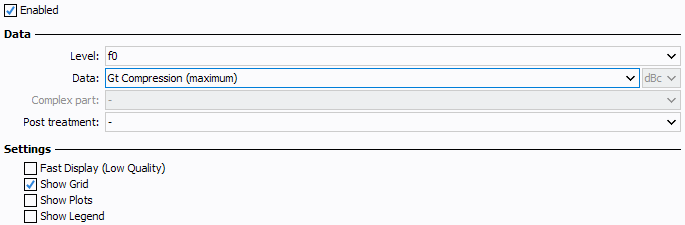
The preview configuration allows to add an associated graph preview, choosing the Y axis data.
 Settings
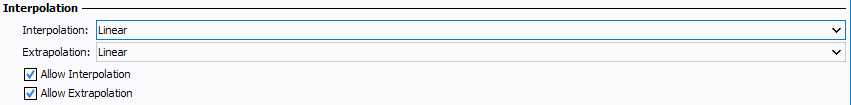
Interpolation Methods : set the method used for Spline and Contours interpolation.
- Spline Available methods:
- linear: Linear interpolation.
- bspline: B-Spline interpolation.
- cspline: C-Spline interpolation.
Available properties:
- sampling: Sampling (all except Linear), default: 50.
- polydeg: Polynomial degree (B-Spline only), default: 2.
 Display
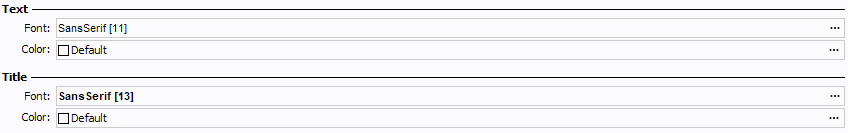
In this section are present all the settings controlling the aesthetic of the merger. They are divided into four sections :
- Text : here can be defined the text (cells) font, color.
- Title : here can be defined the header (title) text font, color.
Example
Define the 'Allowed Curves' of the extractor corresponding to the curve type to extract.
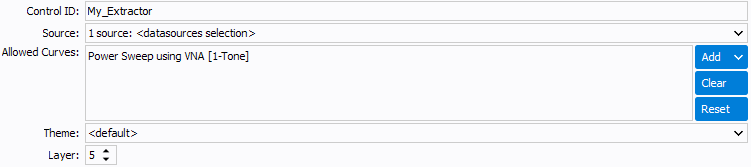
Once the 'Extractor' has been inserted, select 'Gt Compression' as 'Control data'. Then select the data ('PAE', 'Pout' and 'Gt') and variable ('f0') to extract. The extracted data will be sorted in function of f0.
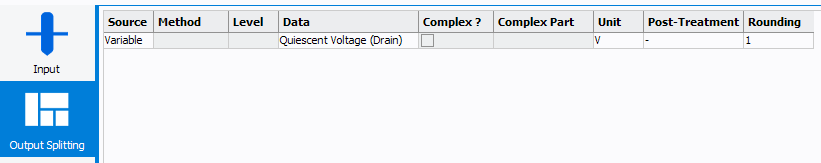
In this example multiple bias measurement have been done, therefore curves are grouped by quiescent bias value using "Output Splitting" option.