Sweep inverter
Overview
The ( ) icon allows to insert a 'Sweep Inverter' control in the whiteboard. 'Sweep
Inverter' control is used to rewrite some sweeps. For example a frequency sweep of a
power sweep can be written as a poser sweep of a frequency sweep.
) icon allows to insert a 'Sweep Inverter' control in the whiteboard. 'Sweep
Inverter' control is used to rewrite some sweeps. For example a frequency sweep of a
power sweep can be written as a poser sweep of a frequency sweep.
Click on the () icon then anywhere in the workspace, drag the mouse to
delimit the Sweep Inverter.
This control has no interactive interface, as it is only parametrizable in its properties.
Example
- Sweep: used to choose the variable to sweep
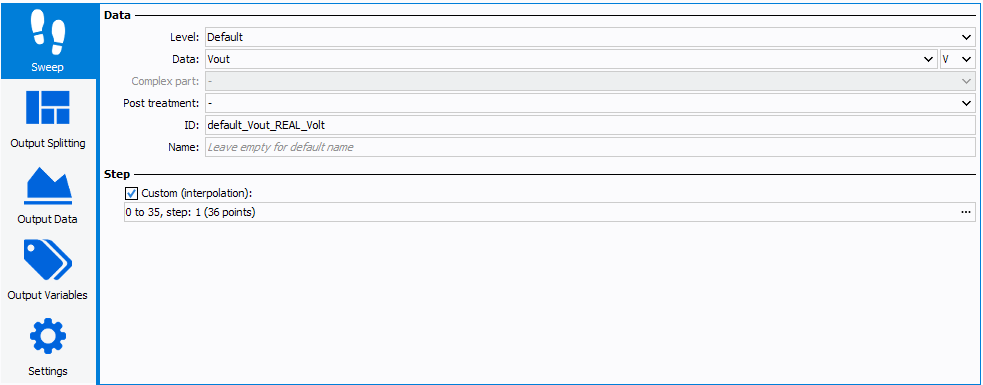
- Data:
- Level: select the frequency level corresponding to
the data to displayNote: The level setting is done to sort the data when harmonics (Level : f0, 2.f0, 3.f0 ...) or 2-tones (Level : 2.f2-f1, f1, f2, 2.f1-f2 ...) measurements analysis are required.
- Data: select the parameter to displayNote: The data list depends on the *.imx file loaded in the 'Datasource, on the 'Allowed curves' defined and on the 'Level' selected. The data list is sorted by alphabetical order.
- Complex Part: select the complex part corresponding to the parameter to display when this one is a complex number (A1,B1,A2,B2, Zin, Zload, ...).
- Post-treatment: allows to invert the sign
- ID: ID of the output data, change to define a custom one
- Name: choose a custom nameNote: Leave empty for default name
- Level: select the frequency level corresponding to
the data to display
- Step: If checked, the interpolation step will be
parametrizable by the user with an interface.Letting the software decide how to interpolate may result in an unwanted solution. The best way to do it is to self define this interpolation by checking Custom and opening the interface by double clicking the line bellow.
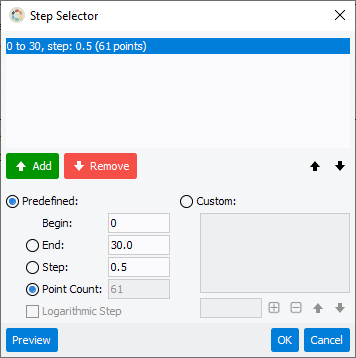
This component is used to define points, either with an intuitive Begin - End - Step/Points usage (Predefined), or with a custom defined list of points. Use ADD or REMOVE to set or unset the lists defined on the top.
- Data:
- Output Splitting: used to splitt the output data in different
curves..
Use the (
 ) buttons to respectively add variables and
data, remove a variable or a data and clear the output splitting list.
Use the (
) buttons to respectively add variables and
data, remove a variable or a data and clear the output splitting list.
Use the ( ) arrows to rearrange the order of the
output splitting list. The output splitting variables and data must be
defined on the board using the following parameters:
) arrows to rearrange the order of the
output splitting list. The output splitting variables and data must be
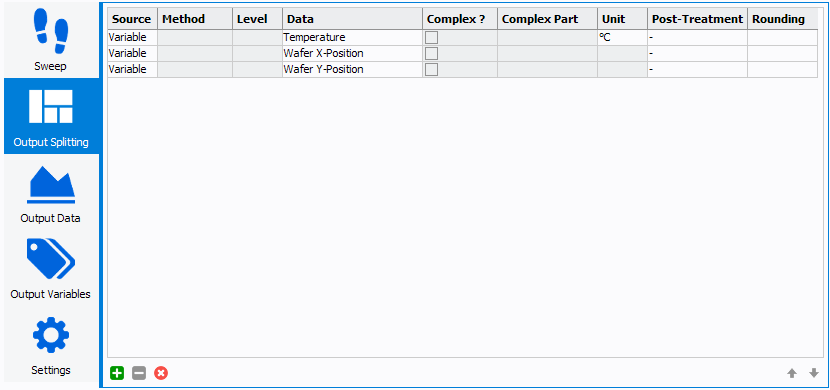
defined on the board using the following parameters:- Source: select if the parameter is a variable or data
- Method: select the method of extraction ('Interpolation', 'Minimum', 'Maximum', 'First', 'Last', 'Average', 'Sum')
- Level: select the frequency level corresponding to the
data to displayNote: The level setting is done to sort the data when harmonics (Level : f0, 2.f0, 3.f0 ...) or 2-tones (Level : 2.f2-f1, f1, f2, 2.f1-f2 ...) measurements analysis are required.
- Data: select the parameter to displayNote: The data list depends on the *.imx file loaded in the 'Datasource, on the 'Allowed curves' defined and on the 'Level' selected. The data list is sorted by alphabetical order.
- Complex: define if the data is a complex or not, if checked, unlocks the following parameter.
- Complex Part: select the complex part corresponding to the parameter to display when this one is a complex number (A1,B1,A2,B2, Zin, Zload, ...).
- Unit: select the unit of the parameter to
display.Note: The unit list depends on the data selected.
- Rounding: the number of decimal digits.
- Output Data: used to setup the output data
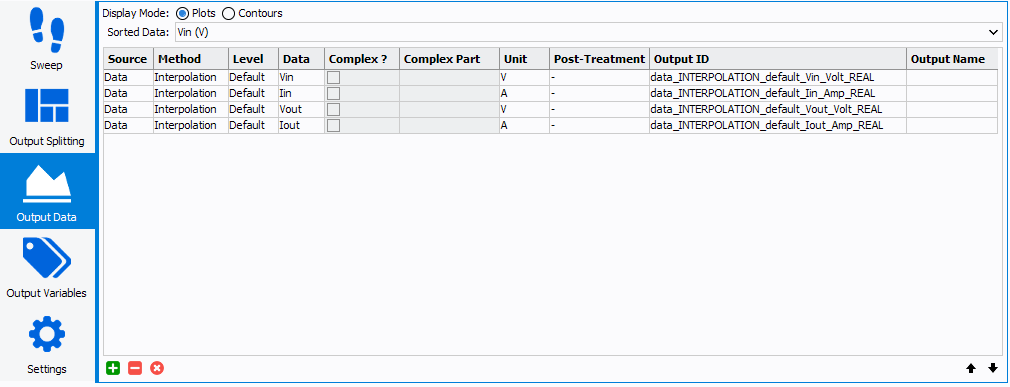
Two Display modes are available : plot or contours
The output data can be sorted with the selected data. Then must be defined on the board the following parameters:
- Source: select if the parameter is a variable or data
- Method: select the method of extraction ('Interpolation', 'Minimum', 'Maximum', 'First', 'Last', 'Average', 'Sum')
- Level: select the frequency level corresponding to the
data to displayNote: The level setting is done to sort the data when harmonics (Level : f0, 2.f0, 3.f0 ...) or 2-tones (Level : 2.f2-f1, f1, f2, 2.f1-f2 ...) measurements analysis are required.
- Data: select the parameter to displayNote: The data list depends on the *.imx file loaded in the 'Datasource, on the 'Allowed curves' defined and on the 'Level' selected. The data list is sorted by alphabetical order.
- Complex: define if the data is a complex or not, if checked, unlocks the following parameter.
- Complex Part: select the complex part corresponding to the parameter to display when this one is a complex number (A1,B1,A2,B2, Zin, Zload, ...).
- Unit: select the unit of the parameter to
displayNote: The unit list depends on the data selected.
- Post-treatment: allows to invert the sign
- Output ID: ID of the output data, change to define a custom one
- Output Name: choose a custom name
- Output Variables: used to splitt the output data in different
curves..
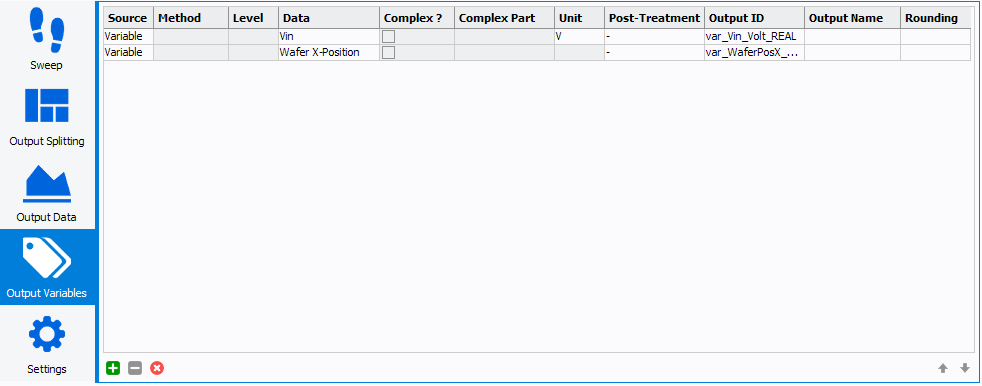
Use the "+", "-" and "x" buttons at the bottom left of the window to respectively add variables and data, remove a variable or a data and clear the output splitting list. Use the up and down arrows at the bottom right of the window to rearrange the order of the output splitting list. The output splitting variables and data must be defined on the board using the following parameters:
- Source: select if the parameter is a variable or data
- Method: select the method of extraction ('Interpolation', 'Minimum', 'Maximum', 'First', 'Last', 'Average', 'Sum')
- Level: select the frequency level corresponding to the
data to displayNote: The level setting is done to sort the data when harmonics (Level : f0, 2.f0, 3.f0 ...) or 2-tones (Level : 2.f2-f1, f1, f2, 2.f1-f2 ...) measurements analysis are required.
- Data: select the parameter to displayNote: The data list depends on the *.imx file loaded in the 'Datasource, on the 'Allowed curves' defined and on the 'Level' selected. The data list is sorted by alphabetical order.
- Complex: define if the data is a complex or not, if checked, unlocks the following parameter.
- Complex Part: select the complex part corresponding to the parameter to display when this one is a complex number (A1,B1,A2,B2, Zin, Zload, ...).
- Unit: select the unit of the parameter to
display.Note: The unit list depends on the data selected.
- Rounding: the number of decimal digits.
- Settings:
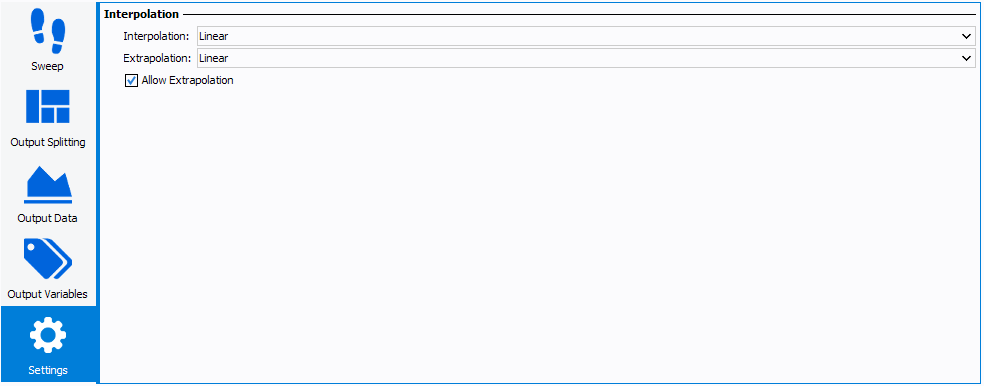
- Interpolation Methods : set the method used for
interpolation.
- Spline Available methods:
- linear: Linear interpolation.
- bspline: B-Spline interpolation.
- cspline: C-Spline interpolation.
Available properties:
- sampling: Sampling (all except Linear), default: 50.
- polydeg: Polynomial degree (B-Spline only), default: 2.
- Spline Available methods:
- Interpolation Methods : set the method used for
interpolation.
Example