Converter
Overview
The (![]() ) icon allows to insert an 'converter' control in the workspace.
'Converter' control is a hidden control which allows to convert a specific curves
type (S-parameters, Power Sweep, Video-Bandwidth, Modulated Power Sweep ... ) into a
"Generic" curve type. This tool is useful when two data provided by two different
input data files formats have to be compared, displayed on the same graph or used to
define custom equations. It's also useful to rename data.
) icon allows to insert an 'converter' control in the workspace.
'Converter' control is a hidden control which allows to convert a specific curves
type (S-parameters, Power Sweep, Video-Bandwidth, Modulated Power Sweep ... ) into a
"Generic" curve type. This tool is useful when two data provided by two different
input data files formats have to be compared, displayed on the same graph or used to
define custom equations. It's also useful to rename data.
Configuration
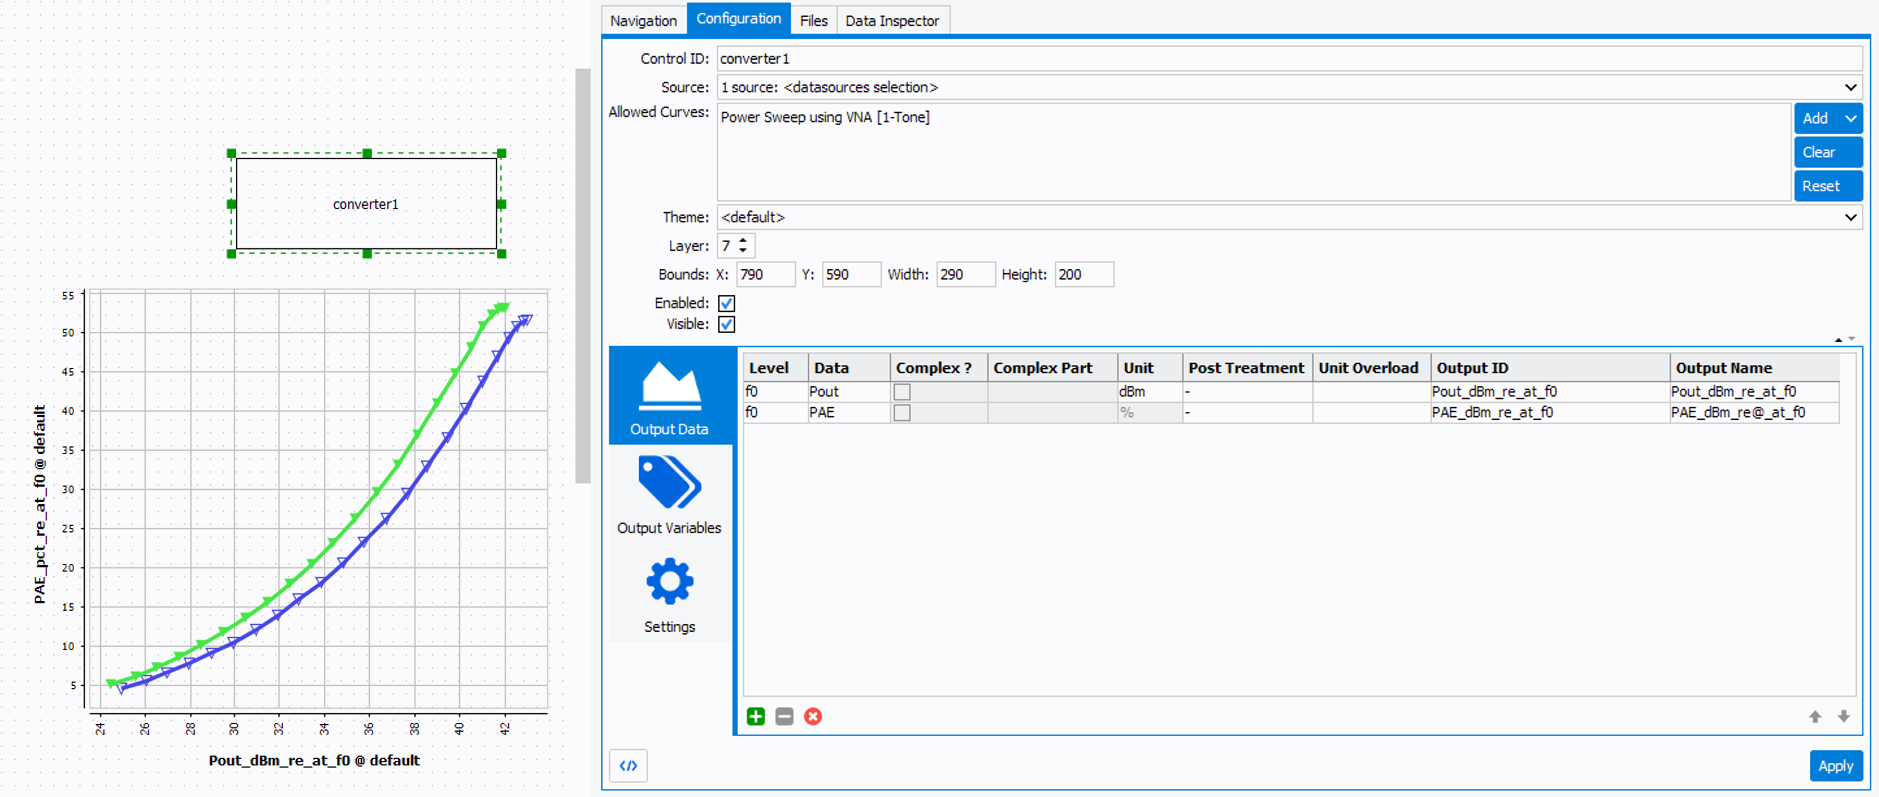
 Output Data
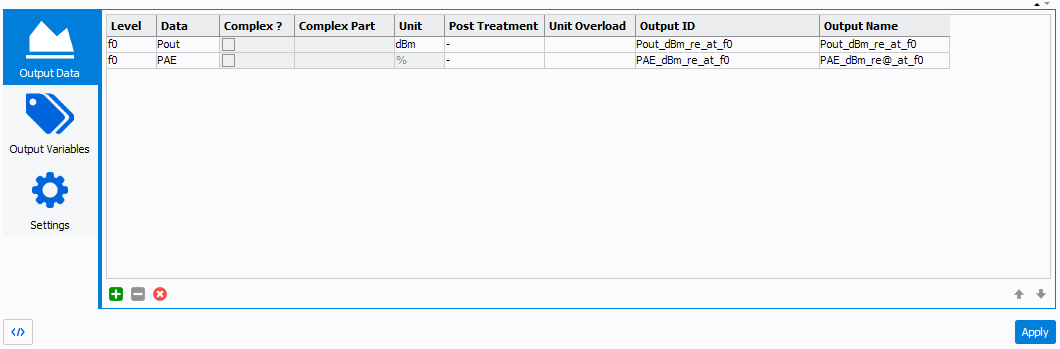
"Output Data" menu allows defining and setting the data to convert.
Click  to
add data and
to
add data and  to delete it.
- Level: select the frequency level corresponding to the data to
displayNote: The level setting is done to sort the data when harmonics (Level : f0, 2.f0, 3.f0 ...) or 2-tones (Level : 2.f2-f1, f1, f2, 2.f1-f2 ...) measurements analysis are required.
- Data: select the parameter to displayNote: The data list depends on the *.imx file loaded in the 'Datasource, on the 'Allowed curves' defined and on the 'Level' selected. The data list is sorted by alphabetical order.
- Complex ?: define if the data is a complex or not, if checked, unlocks the following parameter.
- Complex Part: select the complex part corresponding to the parameter to display when this one is a complex number (A1,B1,A2,B2, Zin, Zload, ...).
- Unit: select the unit of the parameter to displayNote: The unit list depends on the data selected.
- Post-treatment: allows to invert the sign
- Output ID / OutputName: setup a an ID and a name to the output Data.
 Output Variables
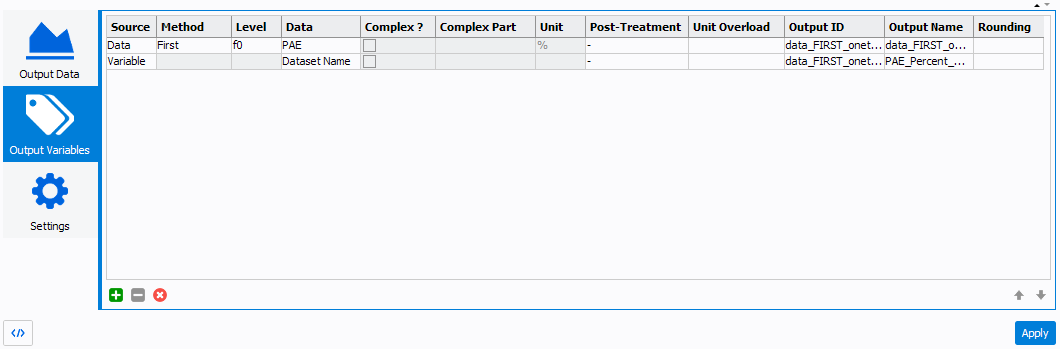
"Output Variables" menu allows defining and setting variables associated to converted curves.
Click to add data and to delete it.
- Source: select if the parameter is a variable or data
- Method: select the method of extraction ( 'Minimum', 'Maximum', 'First', 'Last', 'Average', 'Sum')
- Level: select the frequency level corresponding to the data to
displayNote: The level setting is done to sort the data when harmonics (Level : f0, 2.f0, 3.f0 ...) or 2-tones (Level : 2.f2-f1, f1, f2, 2.f1-f2 ...) measurements analysis are required.
- Data: select the parameter to displayNote: The data list depends on the *.imx file loaded in the 'Datasource, on the 'Allowed curves' defined and on the 'Level' selected. The data list is sorted by alphabetical order.
- Complex ?: define if the data is a complex or not, if checked, unlocks the following parameter.
- Complex Part: select the complex part corresponding to the parameter to display when this one is a complex number (A1,B1,A2,B2, Zin, Zload, ...).
- Unit: select the unit of the parameter to displayNote: The unit list depends on the data selected.
- Post-treatment: allows to invert the sign
- ID: ID of the output curve, change to define a custom one
- Rounding: if a numerical data is used, defines the precision of the number of digits to compare (after the comma).
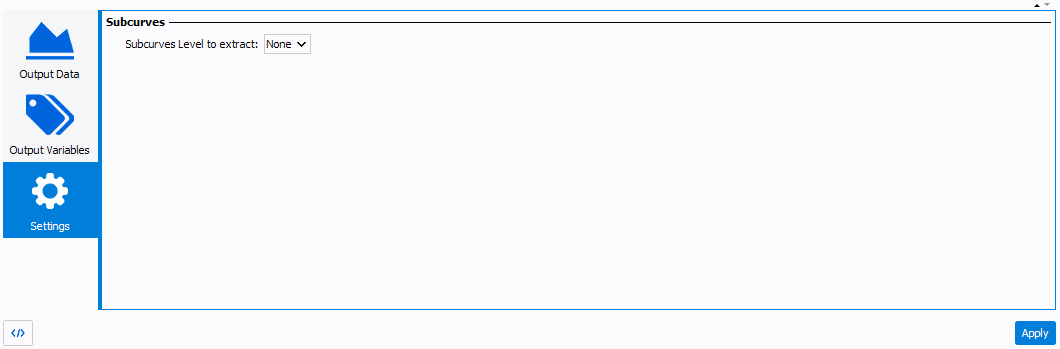
 Settings
"Settings" menu allows setting subcurves level to extract
Example
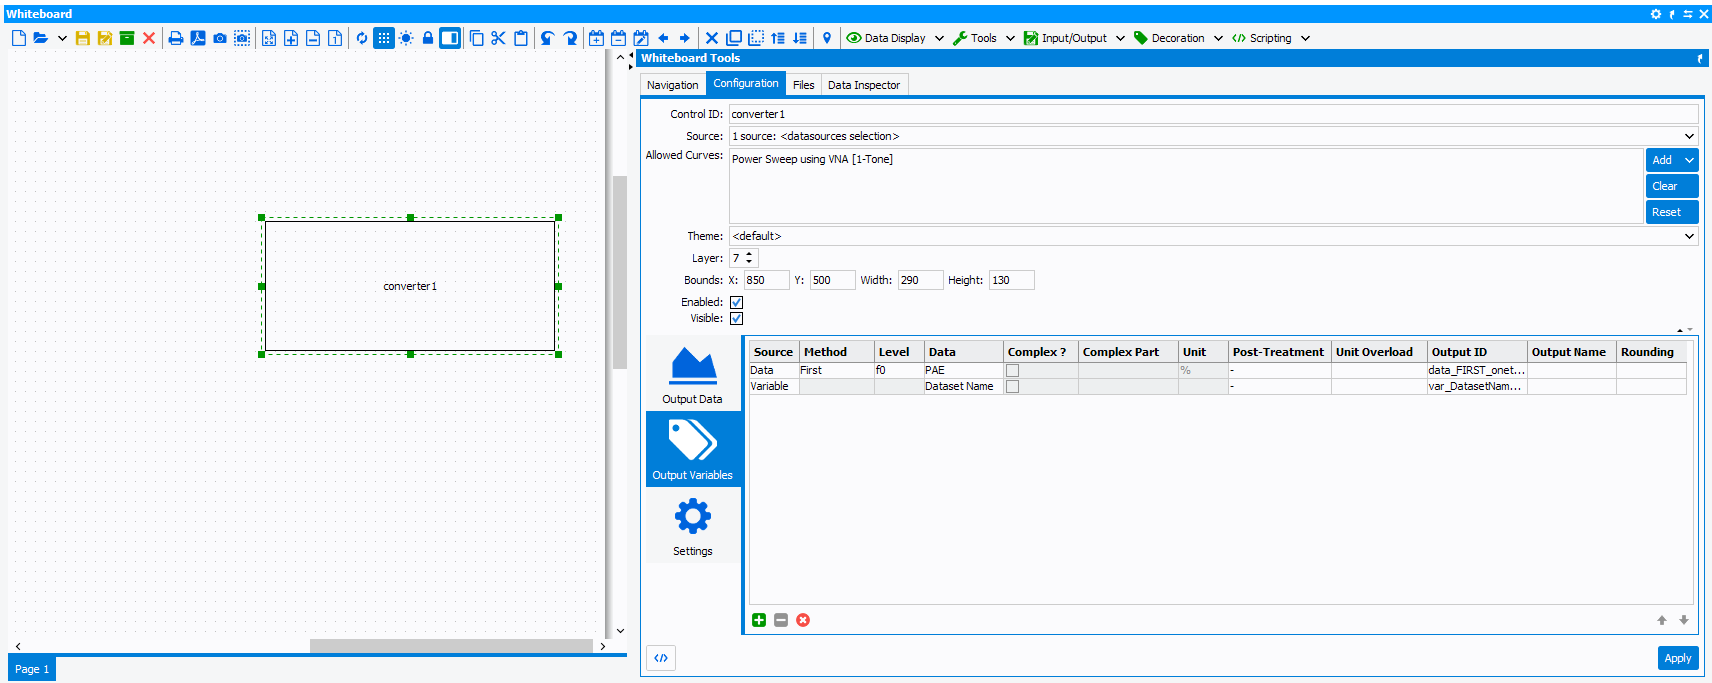
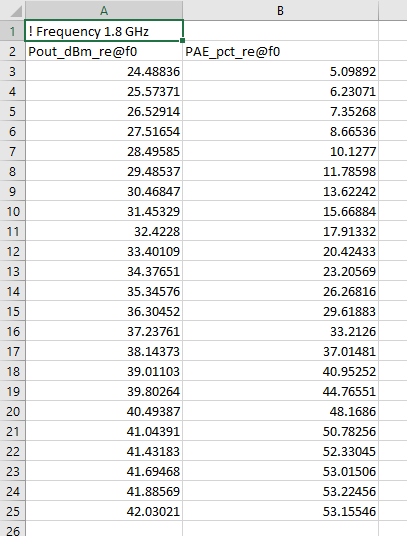
In this example, two data files are loaded in the "datasource" plugin (![]() ). One file
is a measurment file (*.imx) and the second one is a simulation file exported in
(*.csv). The csv file include two data, "Pout_dBm_re@f0" and "PAE_pct_re@f0".
). One file
is a measurment file (*.imx) and the second one is a simulation file exported in
(*.csv). The csv file include two data, "Pout_dBm_re@f0" and "PAE_pct_re@f0".
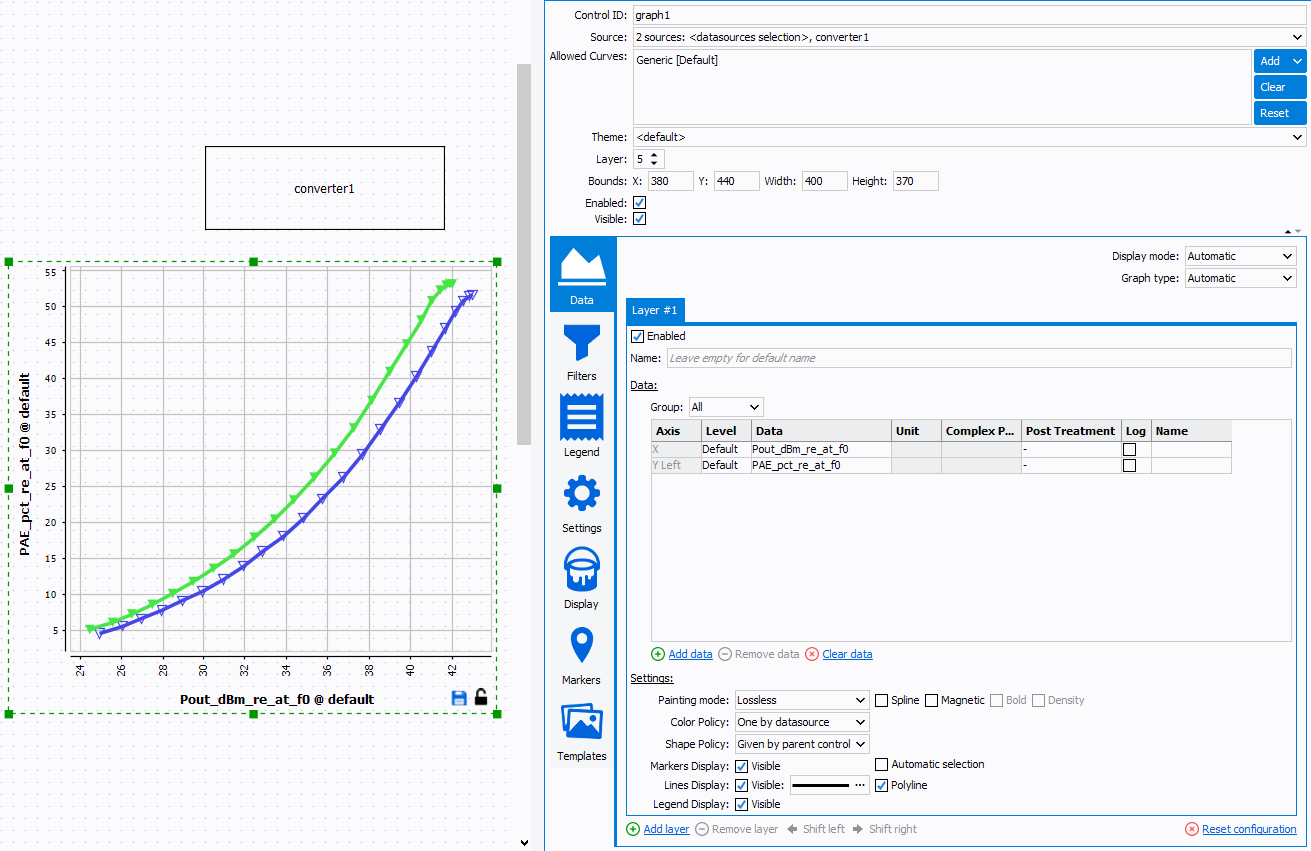
Note that the csv file is automatically a "Generic" curve type. However the measurement is a "Power Sweep using VNA [1-tone]" type and the equivalent data are called Pout and PAE. Therefore "Allowed Curves" and data are incompatible, as shown below:
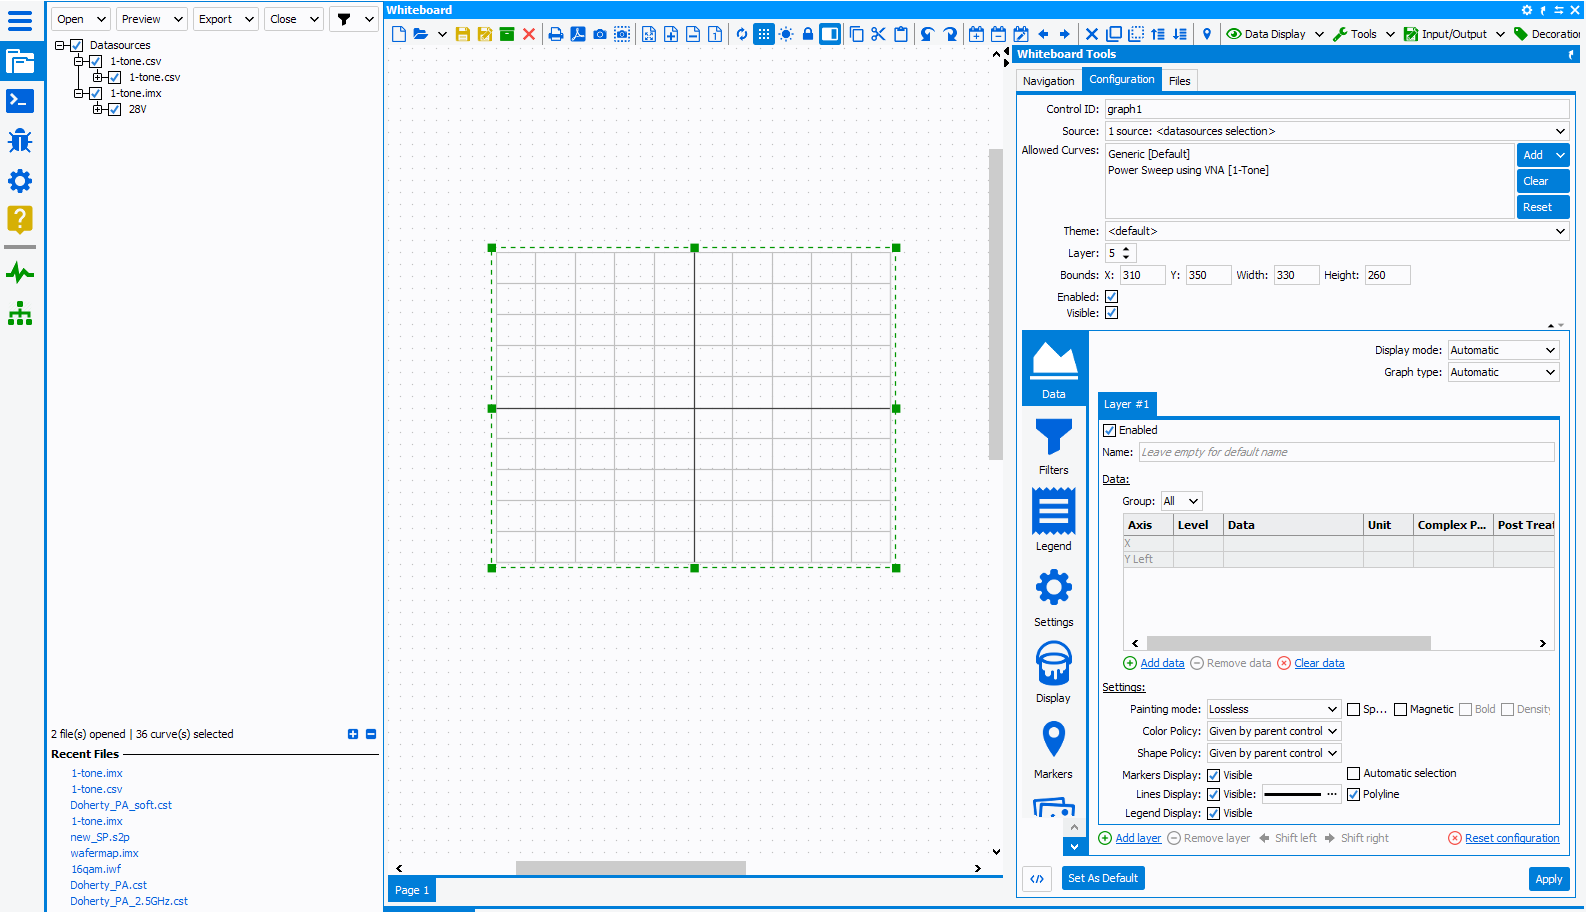
Using the converter, is it possible to convert measurement data in "Generic" format and then rename the data as defined in the *.csv file.
Then define the "allowed curves" of the graph as "Generic" only and plot data.