
Extract an antenna model
How to extract mix electrical/EM model for antenna (ANT). The ANT model is base on SnP and FFD Data. Extracting this model requires Electrical and EM Data coming from Simulation Domain. It takes into account the dispersive effects present in the antenna band and the mismatch introduce with non_50 Ohms element. The general hypothesis of this model is concerning the Far Field hypothesis. This model is interesting for modeling the load pull effects in modern RF front end.
- VISION Device Modeler license. See Installation and licence setup.
- A working project. See Create or open a project.
- An S-parameters file.
The basic steps for extract a ANT model are:
-
Create a new ANT device
In an opened project, you can create a device from Applications window or Workspace window.
- From Applications window, right-click on Device modeler and click on Create device. You can also right-click on ANT and click on Create ANT device.
- From Workspace window, click on Device modeler button, select ANT and click on Open button then New button.
The Create a new device dialog box is displayed.Figure: Create a new ANT device 
- In Type field, select ANT.
- In Model field, select ANT.
- In Name field, edit the name of your device. Here, we will name it "ANT_4x4".
Click on Create button to display the new device in the tree of Applications window and the settings of the extraction in Workspace window.Figure: Extraction settings 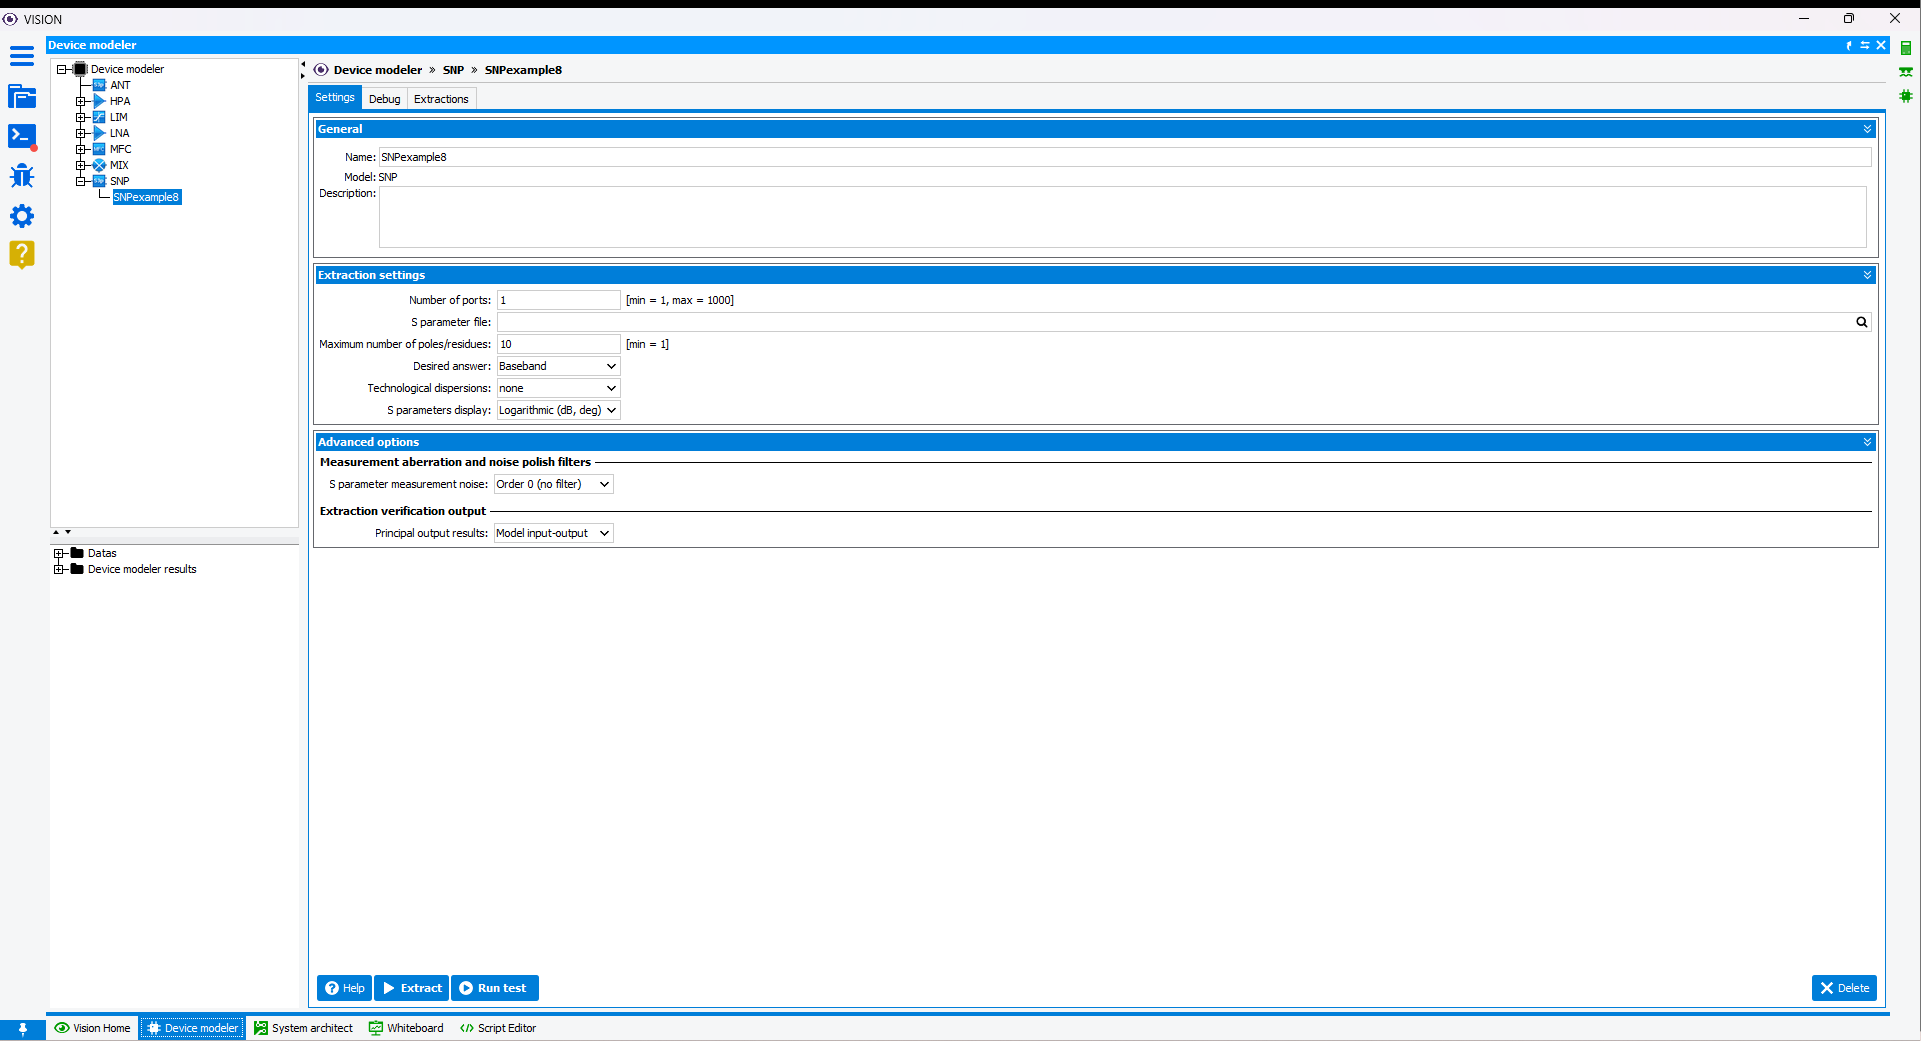
-
Set the number of ports

Set the number of ports corresponding to the measurement file. -
Choose your data file

In the Extraction Settings section, fill in the S parameter file field with the absolute or relative path of your measurement or simulation file with the extension .s2p or .cit . Click on Browser button to open the file browser and select your file in the local
file system. The file browser opens directly to the data directory specified
when creating the project. Now fill the Far filed data directory. Click on
Browser button to open the file browser and select your file in the local
file system.
Browser button to open the file browser and select your file in the local
file system. The file browser opens directly to the data directory specified
when creating the project. Now fill the Far filed data directory. Click on
Browser button to open the file browser and select your file in the local
file system. -
Tune frequency approximation order parameter
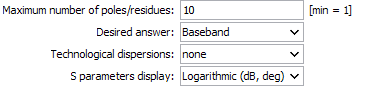
In Maximum number of poles/residues, start to put low orders and checks results graphically after extraction.The Technological dispersions option allows to specify a distribution law of the gain (module) and phase shift characteristics of the amplifier. Two laws of dispersion are possible (Uniform or Gaussian law). The dispersion is characterized by two parameters: the standard deviation Module, given in % of the nominal value for the gain, and the standard deviation Phase in degrees for the phase shift.
-
Extract behavioral model and check with output graphs
Click on
 Extract button to start the extraction
process of the model. The output console is displayed:
Extract button to start the extraction
process of the model. The output console is displayed: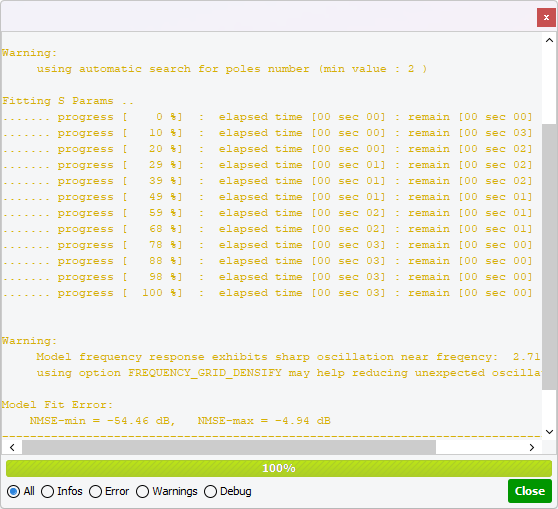 The message Model Fit Error is showing the normalized mean square error (NMSE) between data and model. Close the window to see in the Applications window the number of the newly created extraction, here, 003. The results are saved and can visualized at any time by designating in the tree the associated extraction. Click on the Output graphs tab to see comparisons between data and model.
Figure: Output graphs after ANT model extraction 003 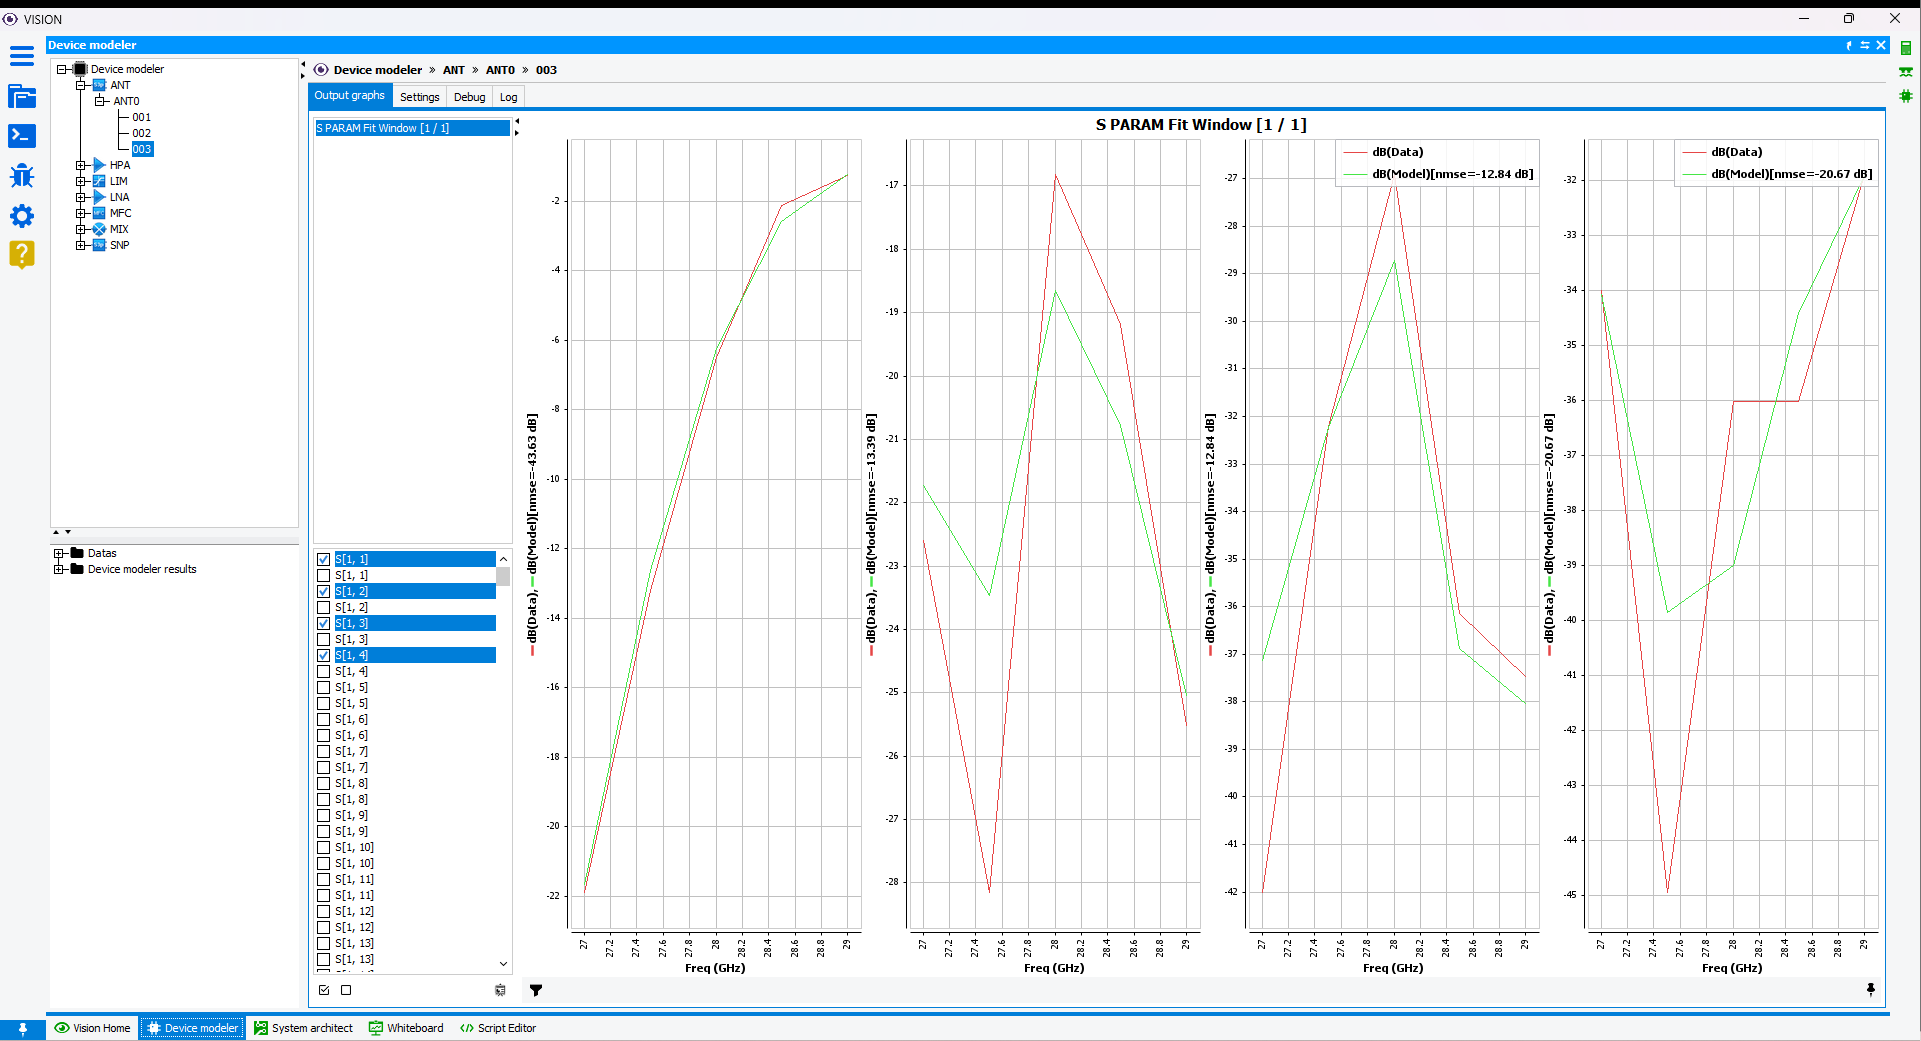
The graphs show the curves of data (from measurement or simulation) in red and the extracted model in green. -
Tune frequency range
If the first extraction is not satisfactory, it is necessary to increase the number of poles/residues. Here, the extraction 004 allow to have the smallest error between the data and the model. You can label an extraction as a reference to differentiate it from others for use in System Architect. Select the appropriate extraction of your device in the Applications , right-click on it, and subsequently select the add to favourites option.
Figure: Output graphs after ANT model extraction 004 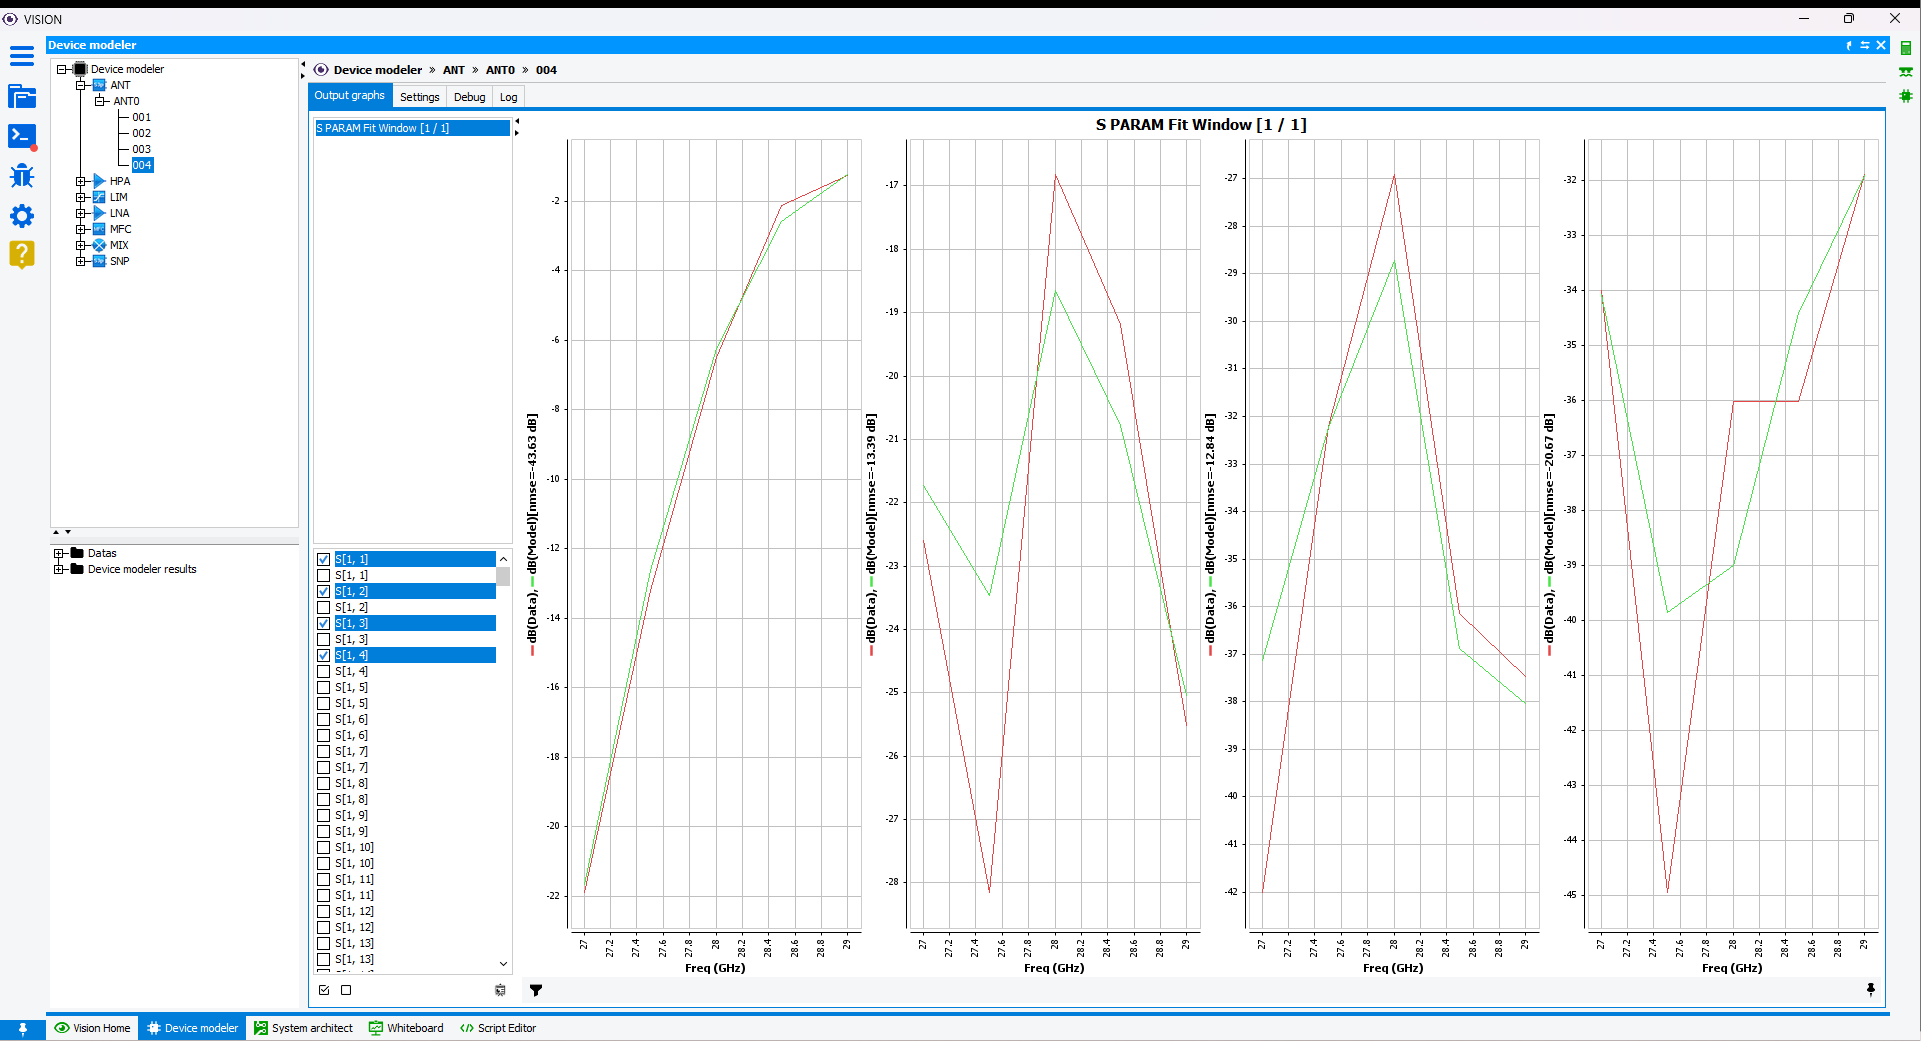
-
FFD description
The last step is to fill in the Far-Field data directory with the absolute or relative path of your Electromagnetic simulation directory with the extension .eep. Click on
Browser button to open the file browser and select your directory in the
local file system.
