Merger
Overview
The (![]() ) icon allows to insert an 'merger' control in the workspace.
'Merger' control is a hidden control which allows to merge multiple curves type in
one.
) icon allows to insert an 'merger' control in the workspace.
'Merger' control is a hidden control which allows to merge multiple curves type in
one.
Configuration
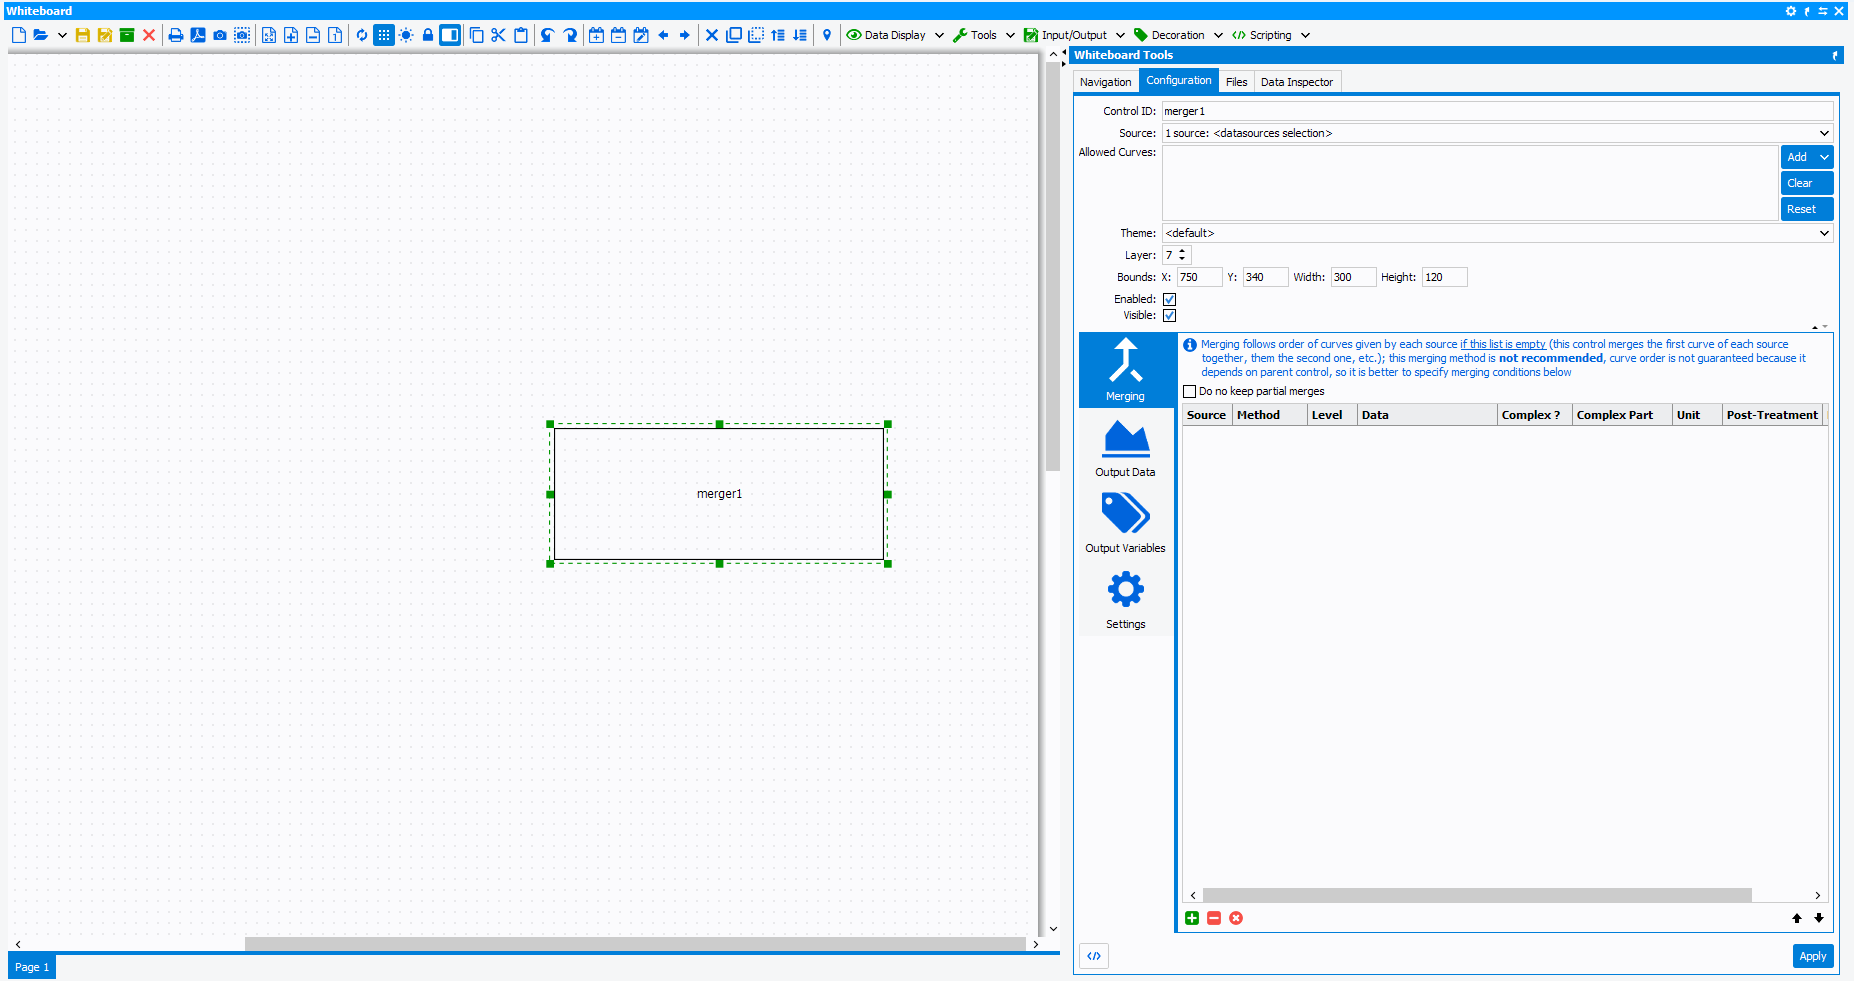
 Merging
When each source provide several curves this etting allows to define merging conditions to ensure curve order.
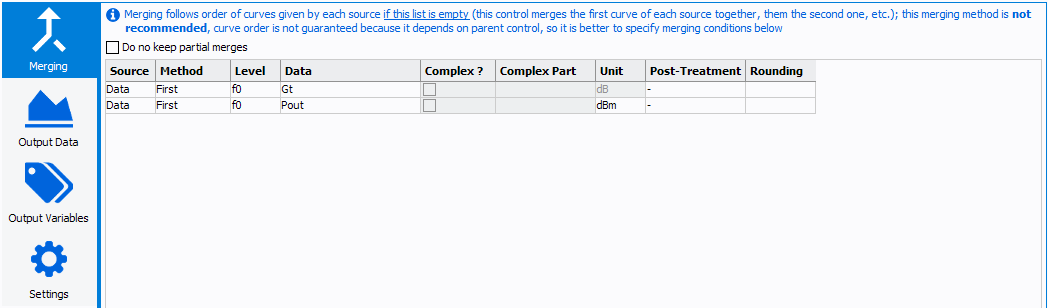
- Level: select the frequency level corresponding to the data to
displayNote: The level setting is done to sort the data when harmonics (Level : f0, 2.f0, 3.f0 ...) or 2-tones (Level : 2.f2-f1, f1, f2, 2.f1-f2 ...) measurements analysis are required.
- Data: select the parameter to displayNote: The data list depends on the *.imx file loaded in the 'Datasource, on the 'Allowed curves' defined and on the 'Level' selected. The data list is sorted by alphabetical order.
- Unit: select the unit of the parameter to displayNote: The unit list depends on the data selected.
- Complex Part: select the complex part corresponding to the parameter to display when this one is a complex number (A1,B1,A2,B2, Zin, Zload, ...).
- Post-treatment: allows to invert the sign
 Output Data
"Output Data" menu allows defining and setting the data to merge.

Click  to
add data and
to
add data and  to delete it.
- Level: select the frequency level corresponding to the data to
displayNote: The level setting is done to sort the data when harmonics (Level : f0, 2.f0, 3.f0 ...) or 2-tones (Level : 2.f2-f1, f1, f2, 2.f1-f2 ...) measurements analysis are required.
- Data: select the parameter to displayNote: The data list depends on the *.imx file loaded in the 'Datasource, on the 'Allowed curves' defined and on the 'Level' selected. The data list is sorted by alphabetical order.
- Complex ?: define if the data is a complex or not, if checked, unlocks the following parameter.
- Complex Part: select the complex part corresponding to the parameter to display when this one is a complex number (A1,B1,A2,B2, Zin, Zload, ...).
- Unit: select the unit of the parameter to displayNote: The unit list depends on the data selected.
- Post-treatment: allows to invert the sign
- Output ID / OutputName: setup a an ID and a name to the output Data.
 Output Variables
"Output Variables" menu allows defining and setting variables associated to merged curves.
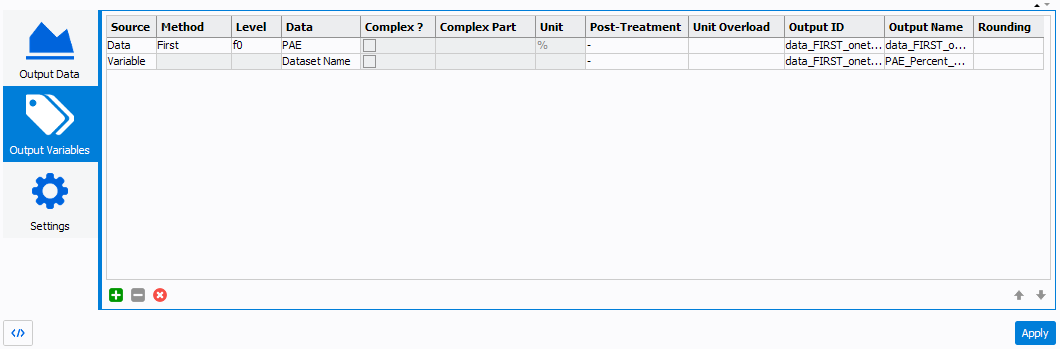
Click to add data and to delete it.
- Source: select if the parameter is a variable or data
- Method: select the method of extraction ( 'Minimum', 'Maximum', 'First', 'Last', 'Average', 'Sum')
- Level: select the frequency level corresponding to the data to
displayNote: The level setting is done to sort the data when harmonics (Level : f0, 2.f0, 3.f0 ...) or 2-tones (Level : 2.f2-f1, f1, f2, 2.f1-f2 ...) measurements analysis are required.
- Data: select the parameter to displayNote: The data list depends on the *.imx file loaded in the 'Datasource, on the 'Allowed curves' defined and on the 'Level' selected. The data list is sorted by alphabetical order.
- Complex ?: define if the data is a complex or not, if checked, unlocks the following parameter.
- Complex Part: select the complex part corresponding to the parameter to display when this one is a complex number (A1,B1,A2,B2, Zin, Zload, ...).
- Unit: select the unit of the parameter to displayNote: The unit list depends on the data selected.
- Post-treatment: allows to invert the sign
- ID: ID of the output curve, change to define a custom one
- Rounding: if a numerical data is used, defines the precision of the number of digits to compare (after the comma).
 Settings
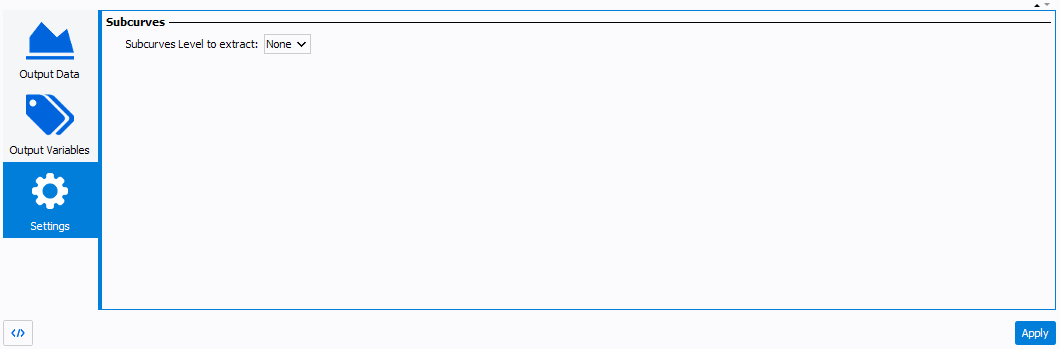
"Settings" menu allows setting subcurves level to extract
Example
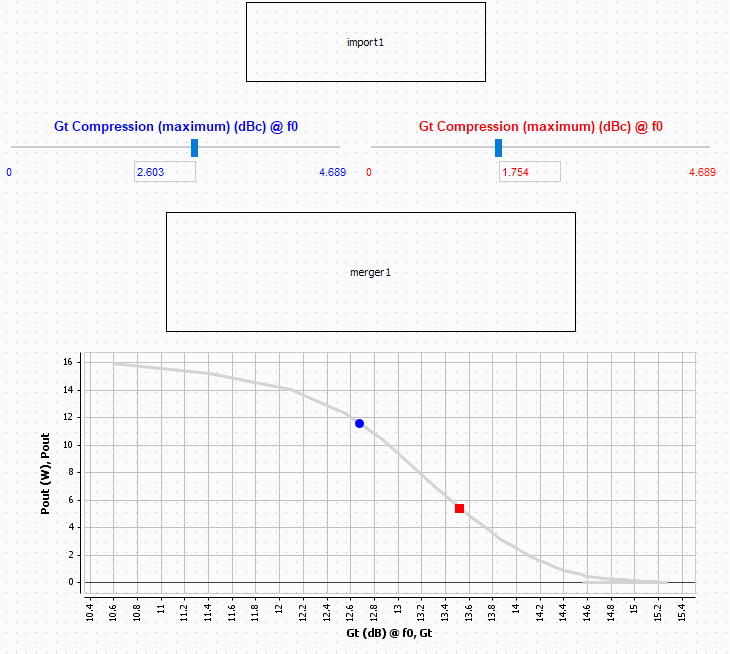
The Import Files block is used to load the 1-tone file, then two Extractor blocks output a gain and a power at a defined compression level. Those two extractors outputs are merged using the merger, and then displayed in a graph.
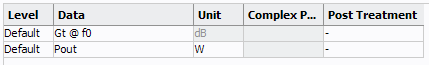
Graph configuration: