
Filter
Overview
The ( ) icon allows to insert a
'filter' control in the workspace. 'Filter' control allows to display curves at
specific conditions (Frequency, Quiescent current, Date, Temperature, Description
...).
) icon allows to insert a
'filter' control in the workspace. 'Filter' control allows to display curves at
specific conditions (Frequency, Quiescent current, Date, Temperature, Description
...).
Click
on the () icon then
anywhere in the workspace, drag the mouse to delimit the filter.
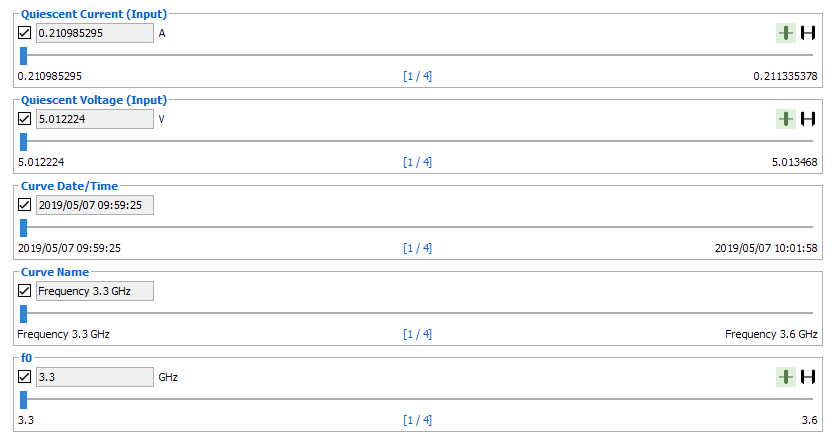
'Filter' control will automatically display all variables containing at least more than one value. It is possible to select the filter variables to display using the filter configuration tab.
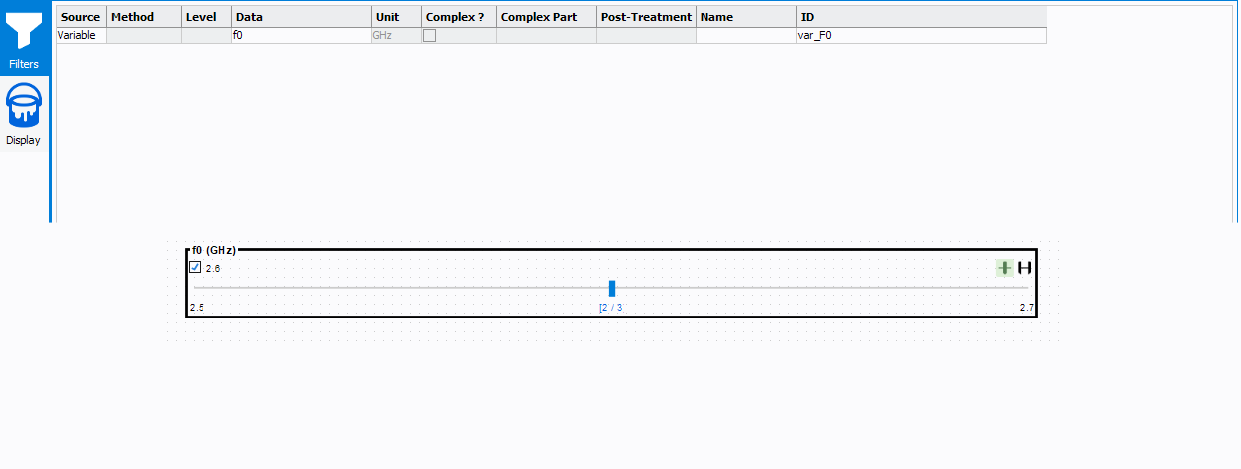
- Source: select if the parameter is a variable or data
- Method: select the method of extraction ('Interpolation', 'Minimum', 'Maximum', 'First', 'Last', 'Average', 'Sum') (Only for data)
- Level: select the frequency level corresponding to the data to
displayNote: The level setting is done to sort the data when harmonics (Level : f0, 2.f0, 3.f0 ...) or 2-tones (Level : 2.f2-f1, f1, f2, 2.f1-f2 ...) measurements analysis are required.
- Data: select the parameter to displayNote: The data list depends on the *.imx file loaded in the 'Datasource, on the 'Allowed curves' defined and on the 'Level' selected. The data list is sorted by alphabetical order.
- Unit: select the unit of the parameter to displayNote: The unit list depends on the data selected.
- Complex: define if the data is a complex or not, if checked, unlocks the following parameter.
- Complex Part: select the complex part corresponding to the parameter to display when this one is a complex number (A1,B1,A2,B2, Zin, Zload, ...).
- Post-treatment: allows to invert the sign
- Name: choose a custom name
- ID: ID of the output curve, change to define a custom one
- Rounding: if a numerical data is used, defines the precision of the number of digits to compare (after the comma).
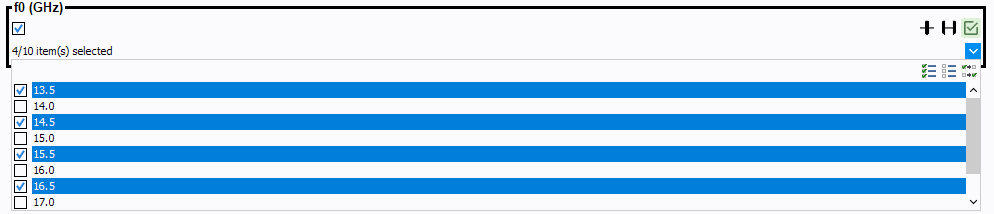
- Multi-Selection: allows to select multiple curves in drop-downl
list mode.
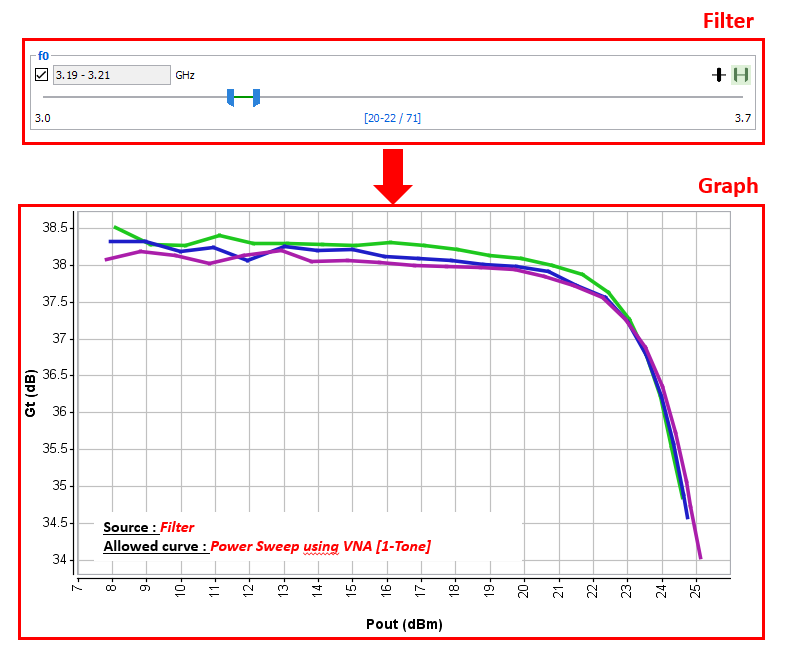
Example
Define the 'Allowed Curves' of the filter control corresponding to the curve type to be filtered.
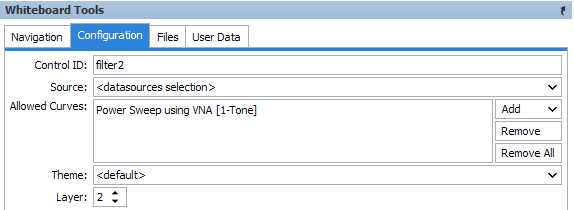
Once the 'Filter' has been set, insert a new Graph to link each
others. Then set the 'Source' of the graph on 'Filter1', and the 'Allowed curves' on the
desired curve type. Once the graph is correctly set, move the filter's sliders to update
the trace plot in the graph.
Note: It is possible to switch in interval mode
in order to display a range of variables.