
1 tone : 3D visualization
This provided template is used to present the whiteboard capabilities using a *.imx file including 1 tone measurements. It can be easily done using the following components :
To use this template, open the whiteboard and load the PAE-Gain-AMPM-IRL_3D.iw template (located in the software installation directory ..\example\app\whiteboard where app is the software name).
Once opened, two choices can be made, either loading a file directly in the datasources section, or clicking on the file in the import control to select and use it. Next, a frequency filter can be used to dynamically visualise in a table and in a graph the corresponding values.
The import control is used to load an embedded file the feed the others controls.
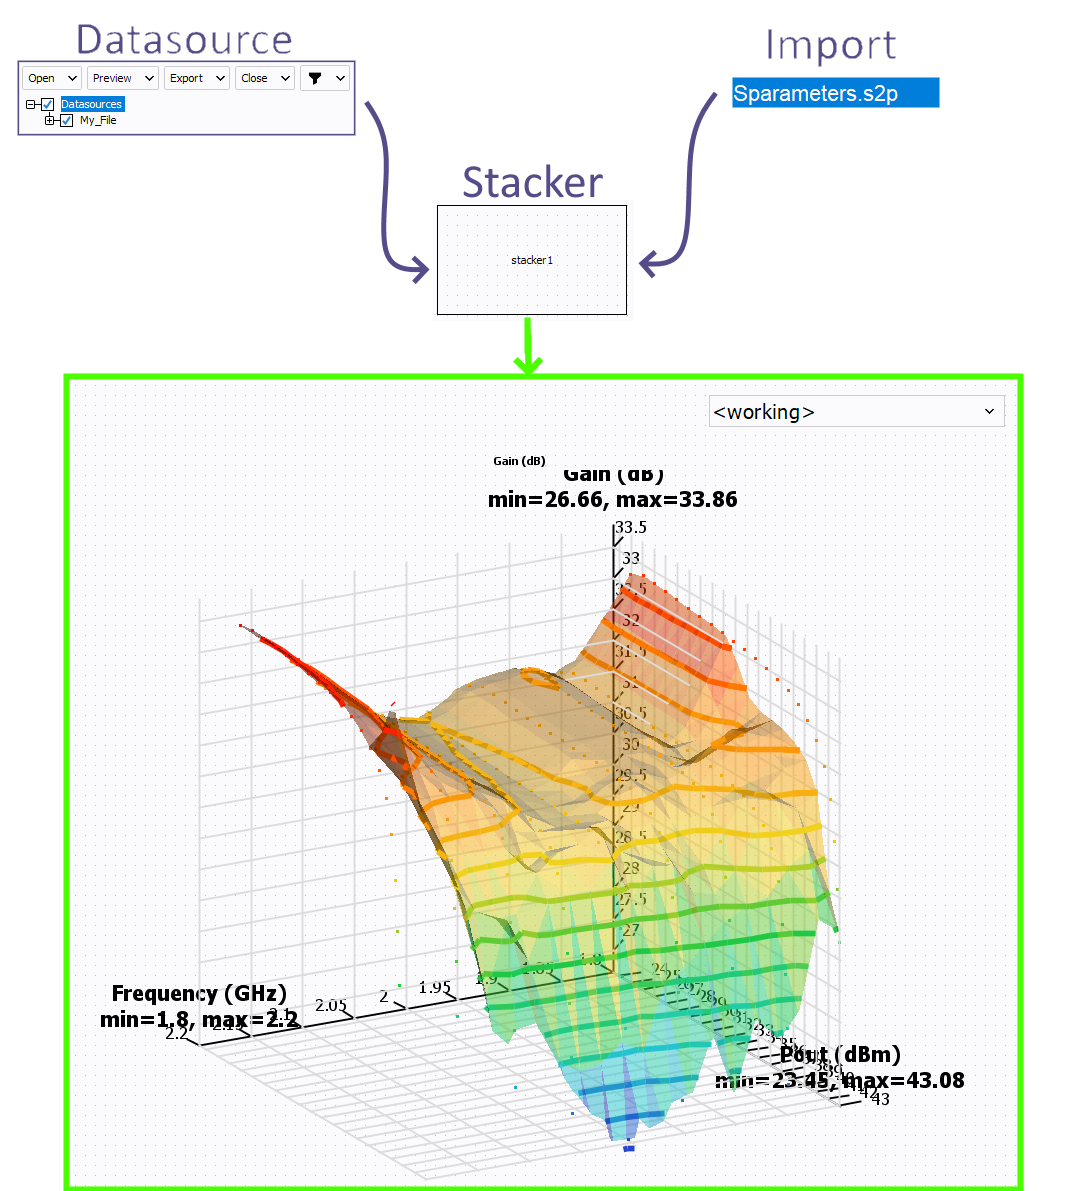
The Stacker is used to stack data with frequency
The Graph is used to display in 3D different values reagarding the template selected.