Whiteboard Concept
The whiteboard visualization uses data files in the 'Datasource' plug-in. To access
'Datasource', click on the ![]() icon on the top left of IQSTAR windows.
icon on the top left of IQSTAR windows.
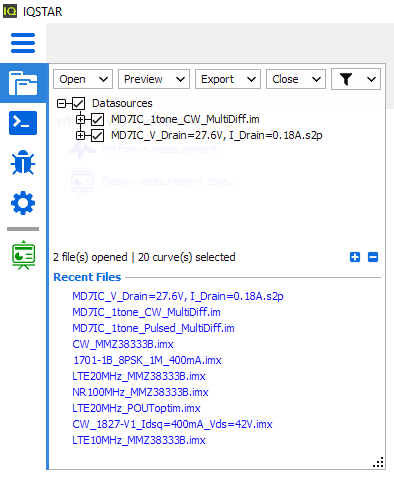
To import measurement files in the 'Datasource', select open or drag and drop files.
Note: Recent files are also listed at the bottom.
The following file formats are supported by the datasource:
-
*.snp (*.s1p, *.s2p, *.s3p, *.s4p) are S parameter measurement files
- *.imx is the IQSTAR measurement file extension. This file can support different type
of measurements:
- Power Sweep using Power Sensors
- Power Sweep using VNA [1-tones, 2tones, ...]
- Video Bandwidth using VNA [2tones IMD3, ...]
- Modulated Power Sweep
- Modulated Power Sweep with DPD
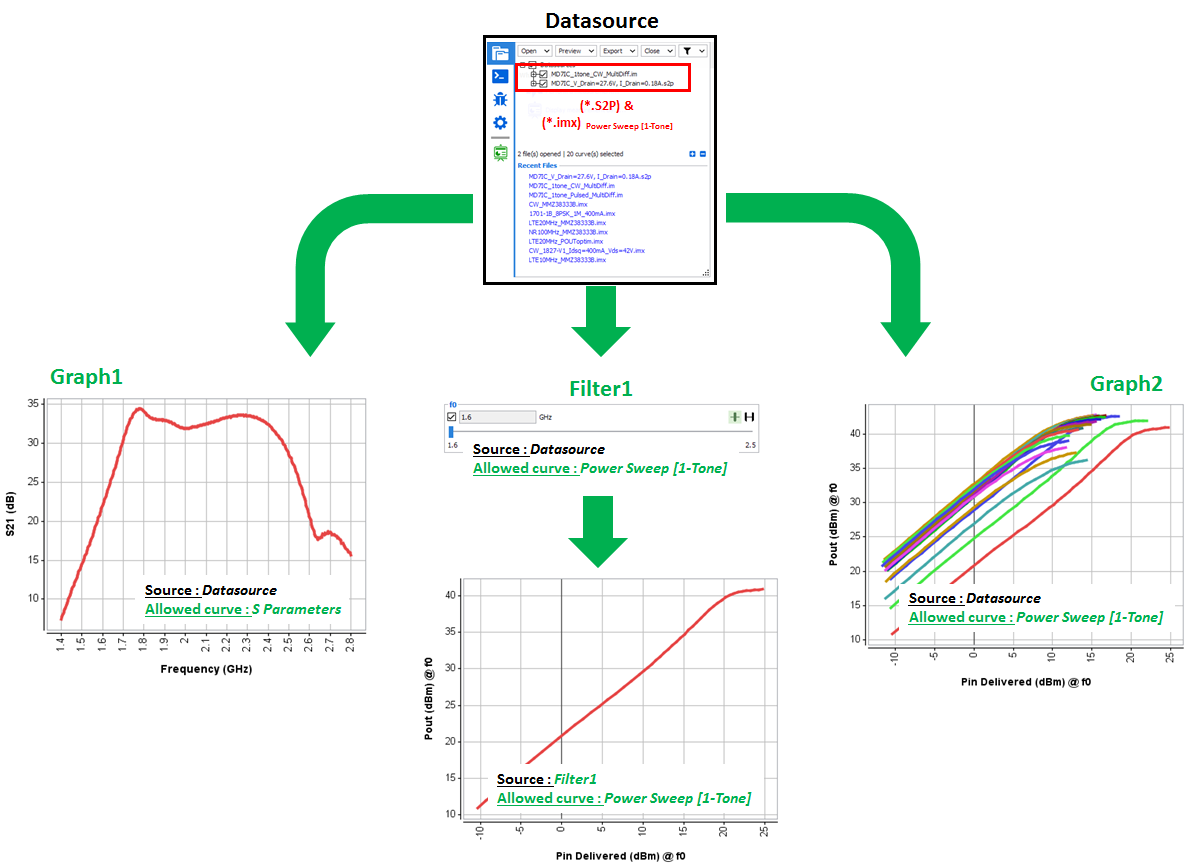
Once the data file is loaded in the 'Datasource', it is possible to create a new graph (Graph) in the workspace windows. Each graph or control plotted have a main source configuration:
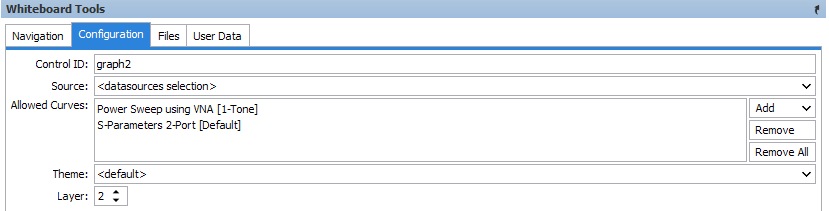
Source configuration of graph and control:
- Control ID: enter a custom graph or control name (Useful to sort the source list)
- Source: select the source used to feed graph or control. The default source is the 'Datasource' but it can be changed to select 'filter', 'extractor', 'stacker' … To learn more see Whiteboard Examples
- Allowed Curves: select the curve type allowed by the graph or
control
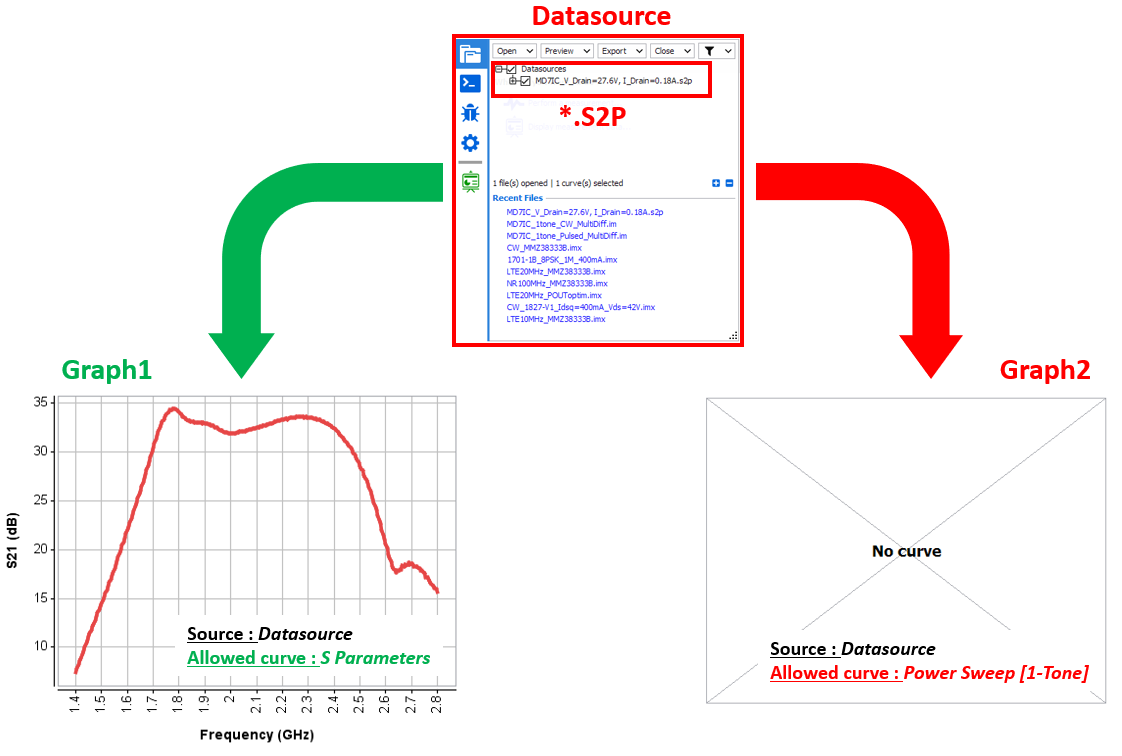
Basically one graph or control can support multiple 'allowed curves'. In this case, the data list will be automatically sorted with the common data between the 'allowed curves' selected. Most of the time, only one 'allowed curve' is selected.Note: Allowed curves selection is automatically updated in function of the datasource file. (e.g.: if one *.s2p file and one *.imx 'Power sweep using VNA' file is detected in the datasource, each new graph and control will be automatically set with both 'allowed curves'). It is possible to remove or add new allowed curve using 'add' and 'remove' icon.