Wafer
Overview
The ( ) icon allows to
insert a 'wafer' control in the whiteboard. 'Wafer' control allows to display
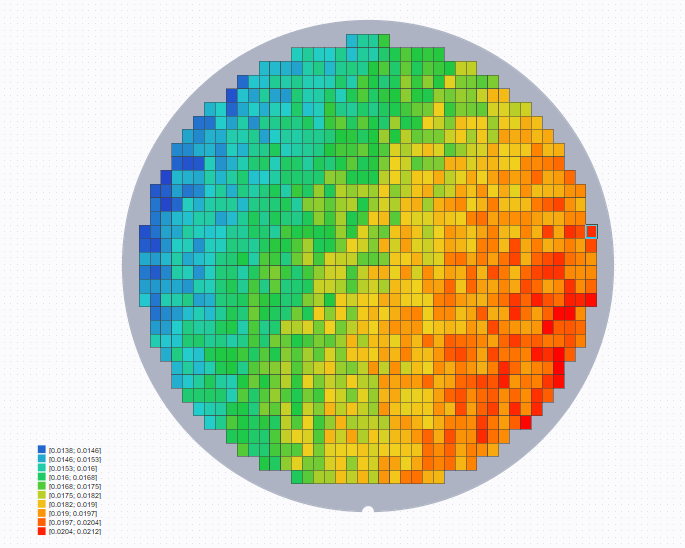
measurement values for each wafer position using gradient color (e.g.: see
behavior of Pout for each die).
) icon allows to
insert a 'wafer' control in the whiteboard. 'Wafer' control allows to display
measurement values for each wafer position using gradient color (e.g.: see
behavior of Pout for each die).
Click on the () icon then
anywhere in the workspace, drag the mouse to delimit the wafer.
How it works
On 'Wafer' control, there are three possibilities of die display:
 Empty: no measurement has been performed for this position
 Colored: only one measurement has been performed for this
position
Colored: only one measurement has been performed for this
position Cross: more than one measurement for this position. Filter can be used to display results on each die.
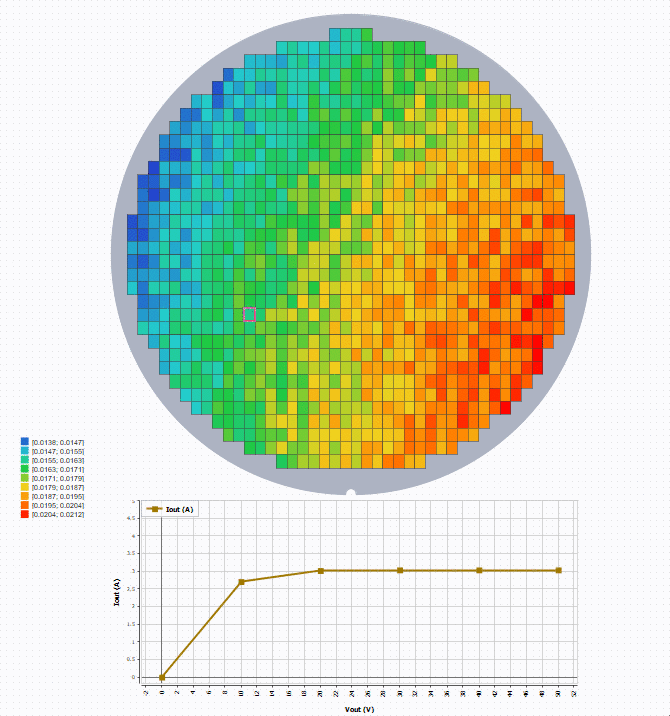
To see the curve at a specific die position, create and configure a Graph with wafer as the source. Then select a position to show
the curve.

Display
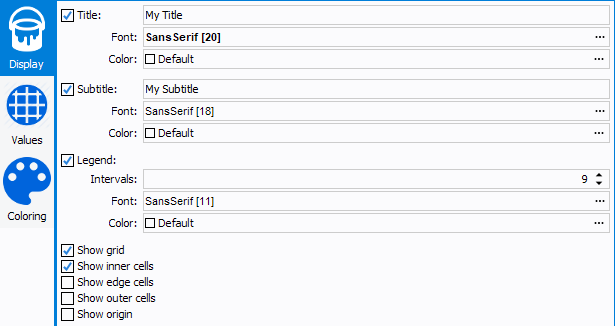
- Title: title of the wafer, will be displayed on top of the control
- Title Font
- Title Color
- Subtitle: subtitle of the wafer, will be displayed on top of the
control, under the title
- Subtitle Font
- Subtitle Color
- Legend: legend of the wafer, will be displayed in the bottom left
corner
- Intervals: Number of ranges to display (min 0, max 20), the higher the number is, the higher the precision will be.
- Legend Font
- Legend Color
- Show grid: display the grid (useful for delimiting dies)
- Show inner cells: show dies inside the wafer (required to display values)
- Show edge cells: show wafer outline dies (not measured)
- Show outer cells: show dies outside the wafer (not measured)
- Show origin: show the die at the position 0;0
Values
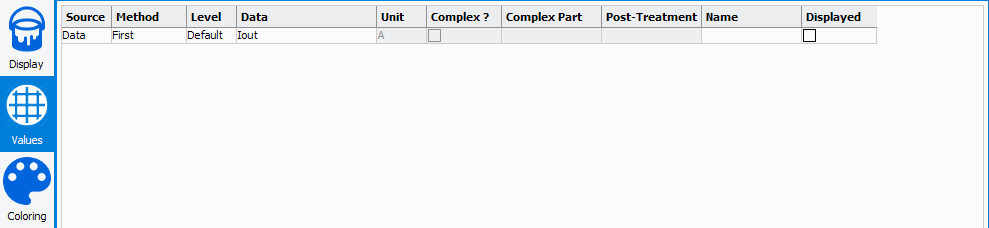
Here can be defined the values to display on each die. The main board can be parametrized as follows:
- Source: select whether the parameter is a variable or data
- Method: select the method of extraction ('Interpolation', 'Minimum', 'Maximum', 'First', 'Last', 'Average', 'Sum')
- Level: select the frequency level corresponding to the data to
displayNote: The level setting is done to sort the data when harmonics (Level : f0, 2.f0, 3.f0 ...) or 2-tones (Level : 2.f2-f1, f1, f2, 2.f1-f2 ...) measurements analysis are required.
- Data: select the parameter to displayNote: The data list depends on the *.imx file loaded in the 'Datasource, on the 'Allowed curves' defined and on the 'Level' selected. The data list is sorted by alphabetical order.
- Unit: select the unit of the parameter to displayNote: The unit list depends on the data selected.
- Complex: check if the value is a complex and unlocks the following parameter.
- Complex Part: select the complex part corresponding to the parameter to display when this one is a complex number (A1,B1,A2,B2, Zin, Zload, ...).
- Post-treatment: allows to invert the sign
- Custom name: choose a custom name
Then, under the board, the following settings are defined:
- Show values: show the value on the die
- Values notation: how will values be displayed
- Values precision: number of digits
- Adaptive precision: when checked, the number of digit in the floating part depends of the value of the integer part; the precision is reduced when the integer part grows up
- Force sign: force the display of the value sign
- Opposite color for the values text: adjusts font color to background color (e.g. write text in white if the background color is black)
Coloring
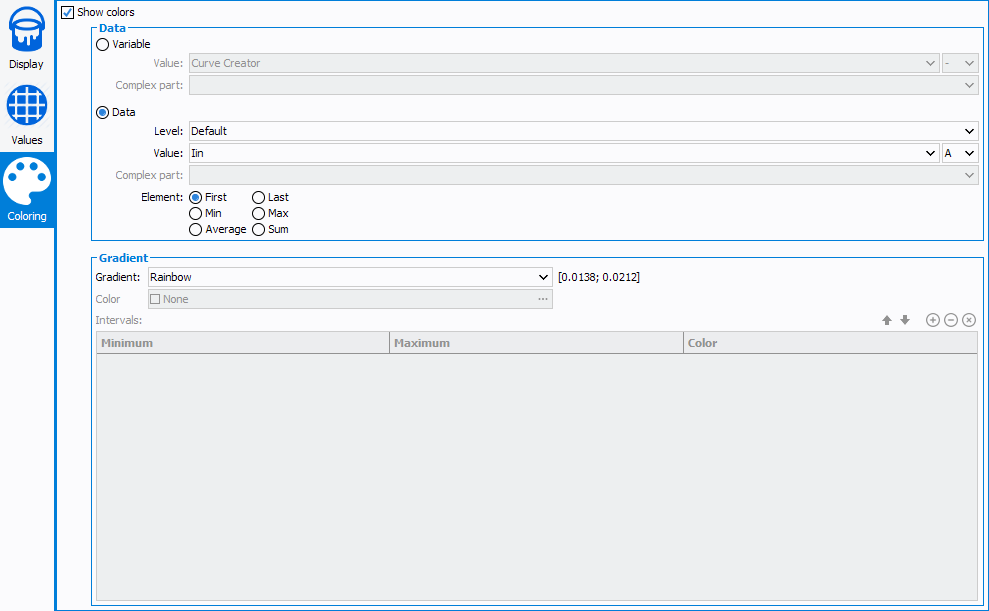
- Show color: enables the configuration of the wafer coloration
- Data editor: define the data to display, can be either Variable or Data
- Gradient editor: define behavior of colors
- Gradient: types of gradient will be used
- Rainbow: blue to red colors (minimum to maximum)
- Gray-scale: black and white rainbow, white to black (minimum to maximum)
- One color: use only one color (defined thereafter), not compliant with 'interval count' option
- Intervals: defines custom intervals (defined thereafter), not compliant with 'interval count' option
- Color: used by One color gradient to define the color to display
- Intervals: used by Intervals gradient to
define the intervals to display
 : add
a new interval
: add
a new interval :
remove selected intervals
:
remove selected intervals :
clear all intervals
:
clear all intervals : move
interval above
: move
interval above : move
interval below
: move
interval below
Note: Empty minimum or maximum cell will use infinite value
- Gradient: types of gradient will be used
Example
Here is an example of a wafer being a source of a Graph, that allows (with a selection of a die) to
display on a graph some curves.