
2 tones : CI3, Pout, PAE and Gain vs Delta at YdBm Output Power
This provided template is used to present the whiteboard capabilities using a *.imx file including 1 tone measurements. It can be easily done using the following components :
To use this template, open the whiteboard and load the CI3-Pout-PAE-Gain_vs_Delta_@YdBm_Output_Power.iw template (located in the software installation directory ..\example\app\whiteboard where app is the software name).
Once opened, two choices can be made, either loading a file directly in the datasources section, or clicking on the file in the import control to select and use it. Next, a frequency filter can be used to dynamically visualise in a table and in a graph the corresponding values.
The project schematic is as follows, where the lines represent the data being fed from a control to another :
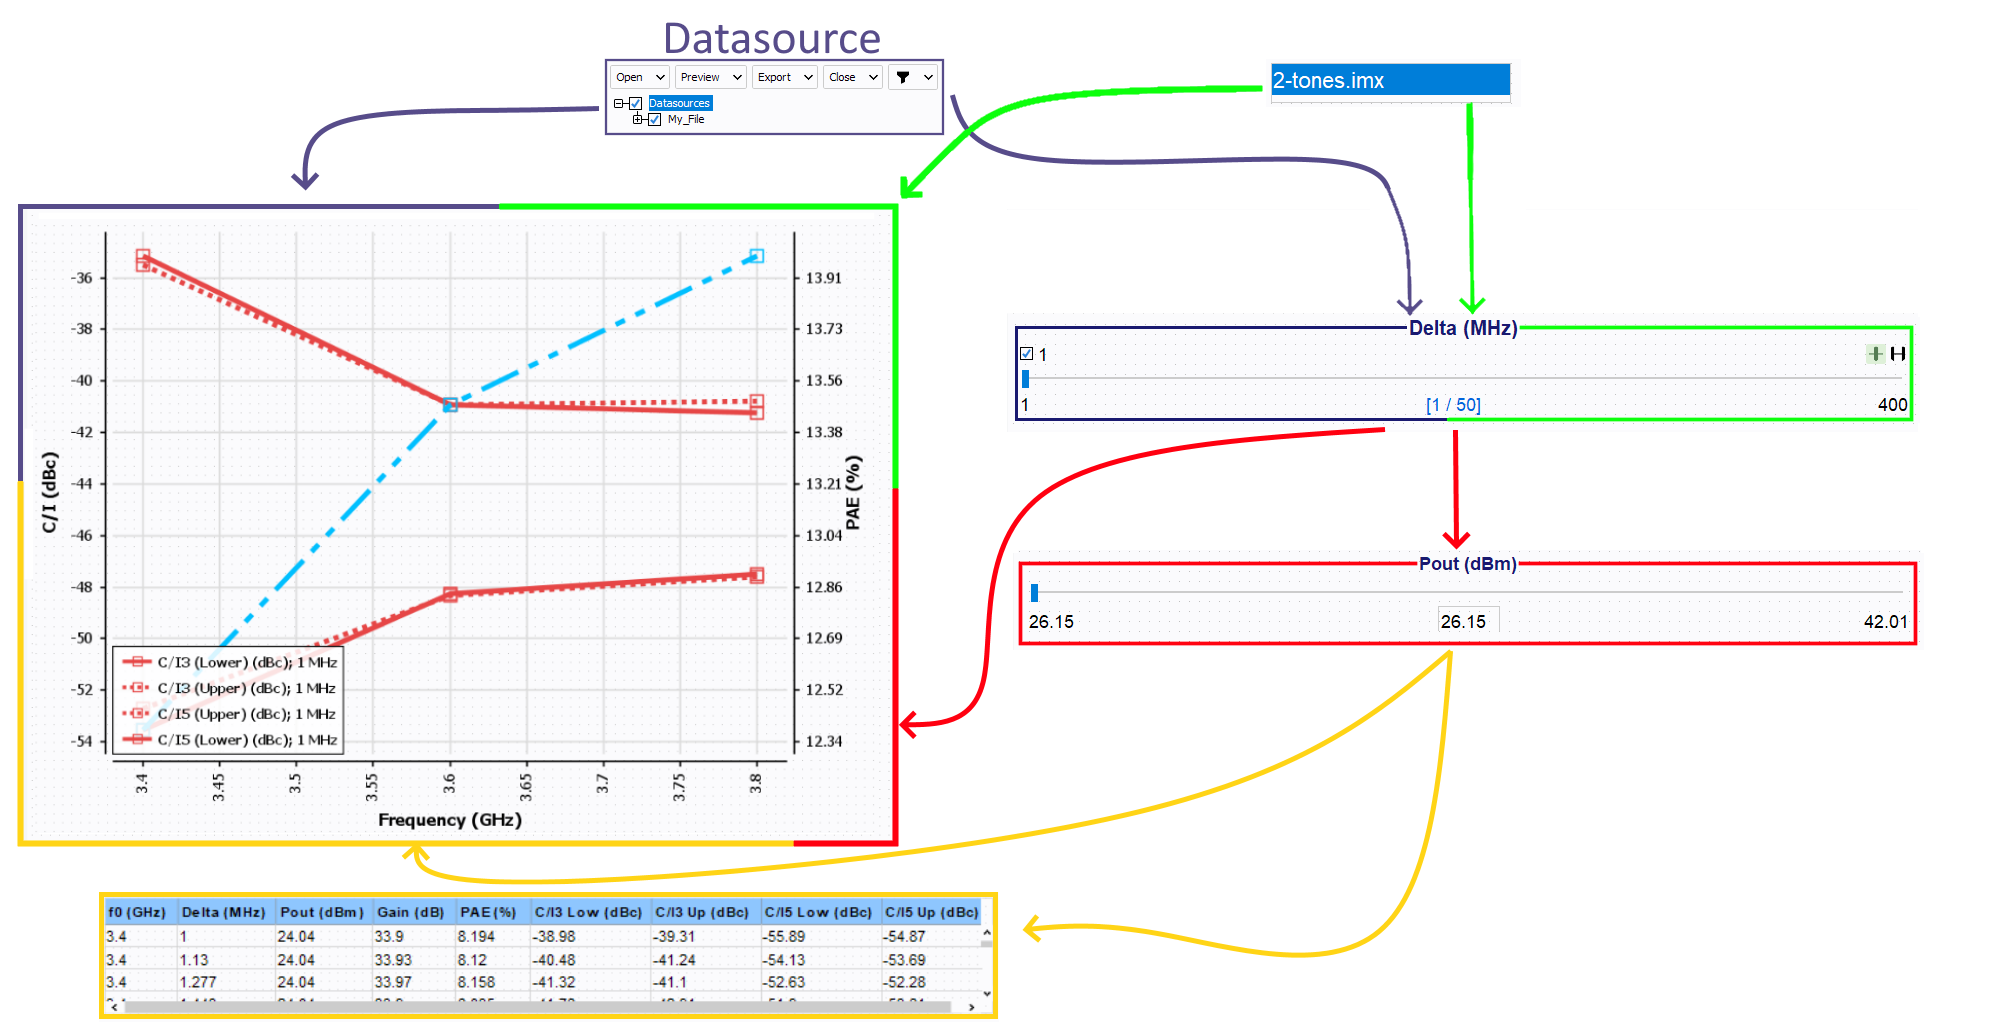
The import control is used to load an embedded file the feed the others controls.
The Filter is used to select one or many frequencies to analyse and display as it is the highest placed control in this example in term of hierachy.
The Extractor is used to extract some values at a defined output power value.
The Table is used to display the values extracted by the Extractor, and is configured as a data table.
- The first and second layers are used to display the C/I3 curves (red).
- The third and fourth layers are used to display the C/I5 curves (red).
- The fifth layer is used to display the PAE (blue).