
1 tone : Frequency Sweep at max PAE
This provided template is used to present the whiteboard capabilities using a *.imx file including 1 tone measurements. It can be easily done using the following components :
To use this template, open the whiteboard and load the Pout-PAE-Gain-AMPM-IRL_vs_Frequency_@MaxPAE.iw template (located in the software installation directory ..\example\app\whiteboard where app is the software name).
Once opened, two choices can be made, either loading a file directly in the datasources section, or clicking on the file in the import control to select and use it. Next, a frequency filter can be used to dynamically visualise in a table and in a graph the corresponding values.
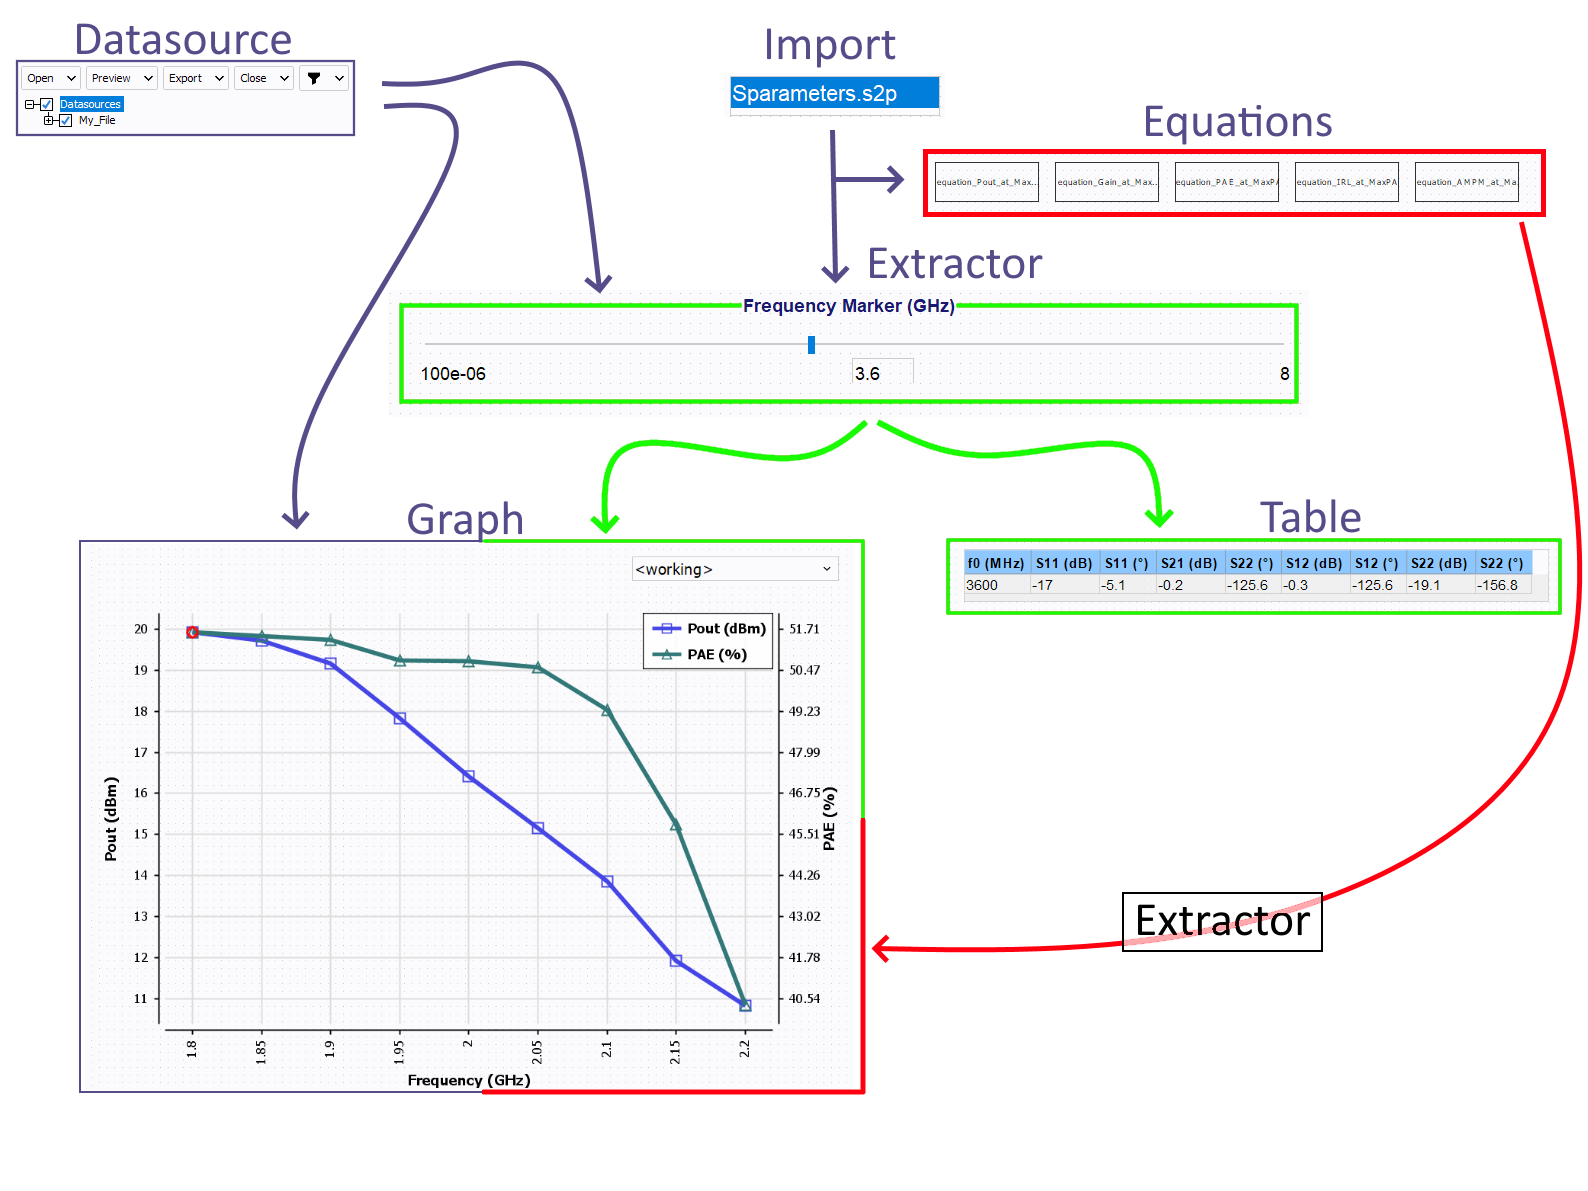
The import control is used to load an embedded file the feed the others controls.
The Extractor are used to extract the S parameters at the desired frequency, that is displayed on the table and at the same time in the graph (squared markers).
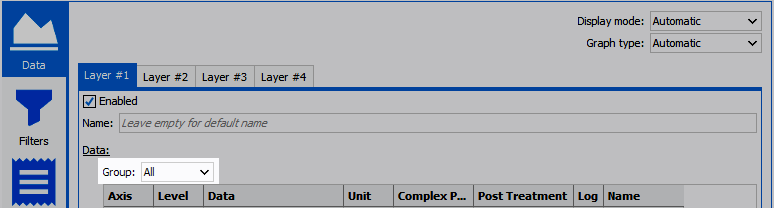
The Table is used to display the values extracted by the Extractor, and is configured as a summary table.
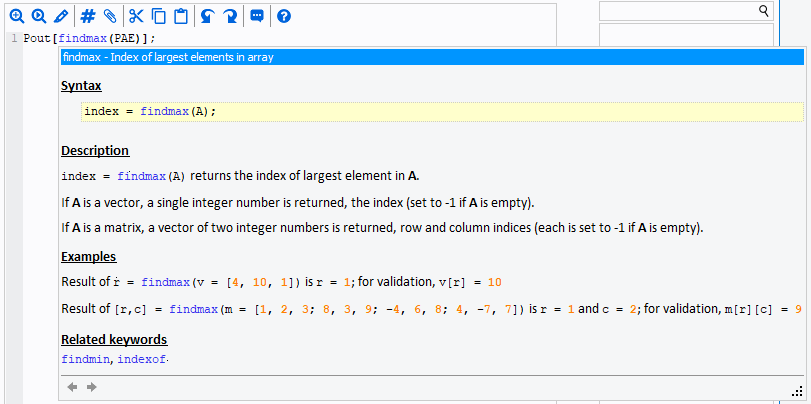
- The first layer is used to display the values selected by the hidden Extractor, who is fed by all the equations.
- The second layer is used to display the values selected by the frequency
Extractor.Note: This can easily be seen with the following property:
Many templates are available to configure and visualize different data in this Graph.