
1 tone : Frequency Sweep at X dB comp
This provided template is used to present the whiteboard capabilities using a *.imx file including 1 tone measurements. It can be easily done using the following components :
To use this template, open the whiteboard and load the Pout-PAE-Gain-AMPM-IRL_vs_Frequency_@XdBcomp.iw template (located in the software installation directory ..\example\app\whiteboard where app is the software name).
Once opened, two choices can be made, either loading a file directly in the datasources section, or clicking on the file in the import control to select and use it. Next, a frequency filter can be used to dynamically visualise in a table and in a graph the corresponding values.
The project schematic is as follows, where the lines represent the data being fed from a control to another :
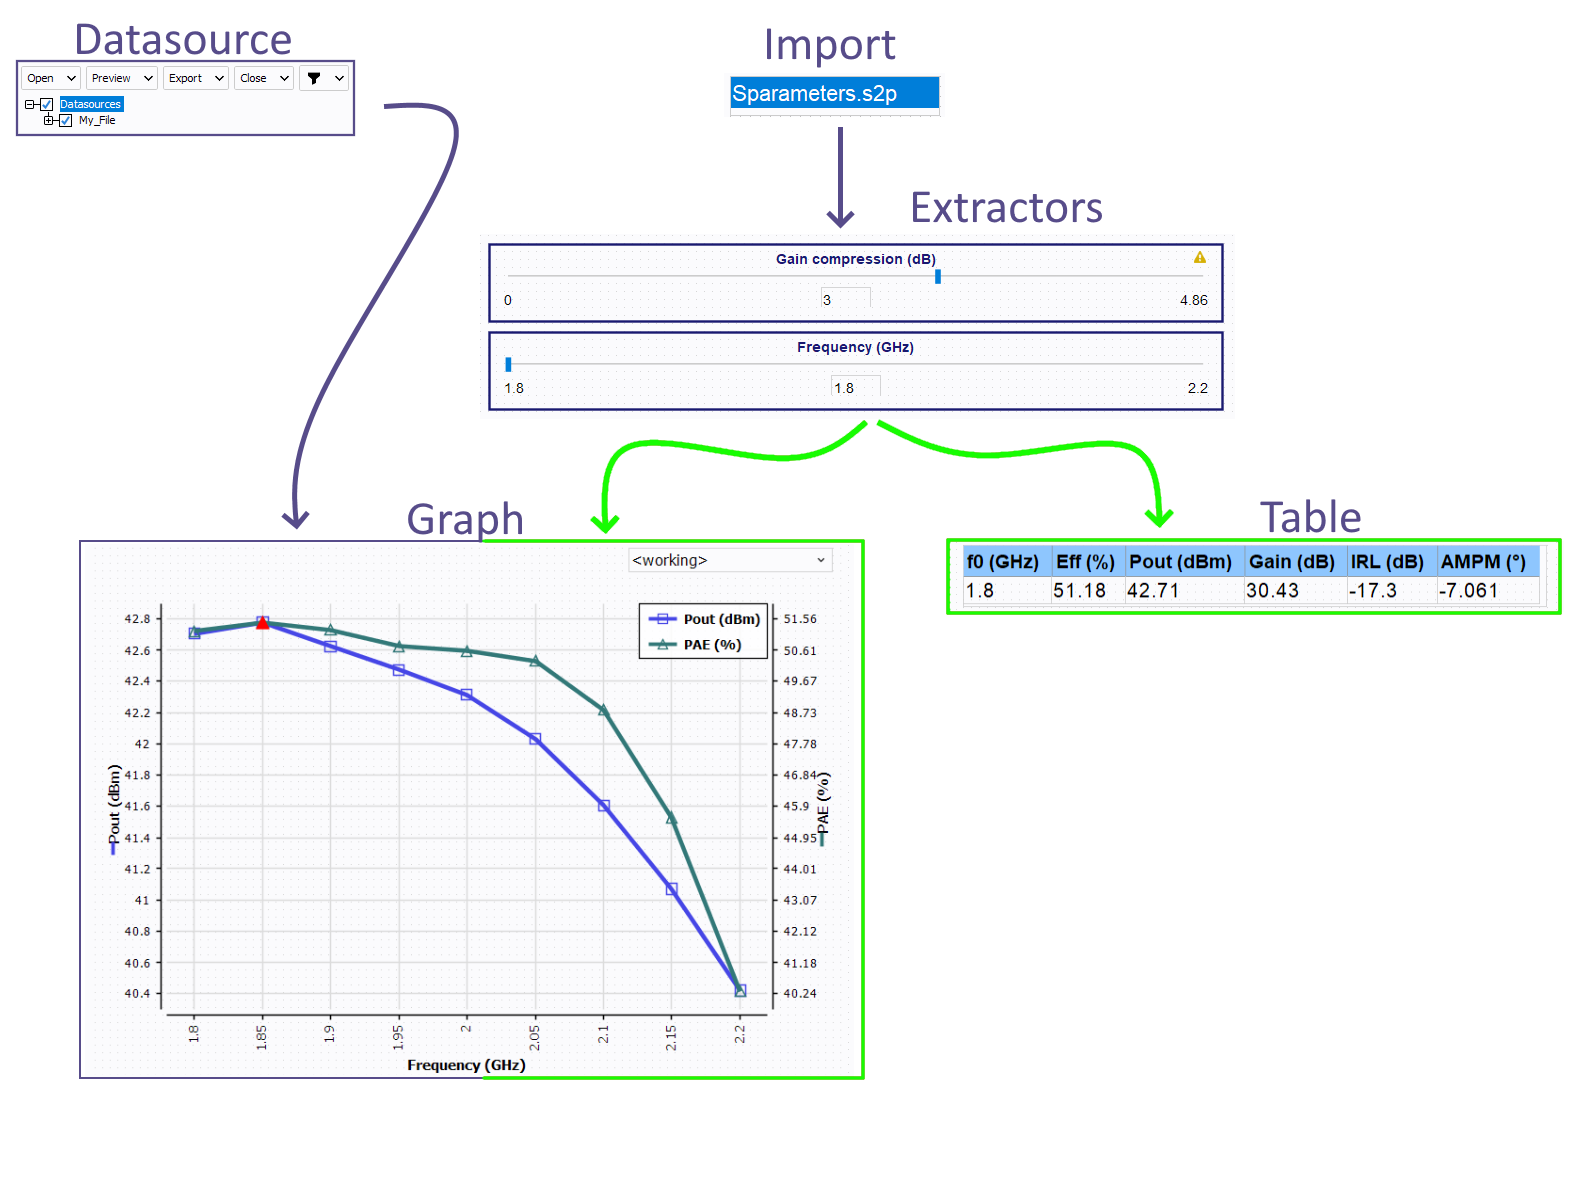
The import control is used to load an embedded file the feed the others controls.
The Extractors are used to extract some values at a defined gain compression value and a defined frequency value.
The Table is used to display the values extracted by the Extractors, and is configured as a summary table.
- The first layer is used to display every curves (as they are provided in the source : datasource or import control) in gray.
- The second layer is used to display the values selected by the Extractor.Note: This can easily be seen with the following property:
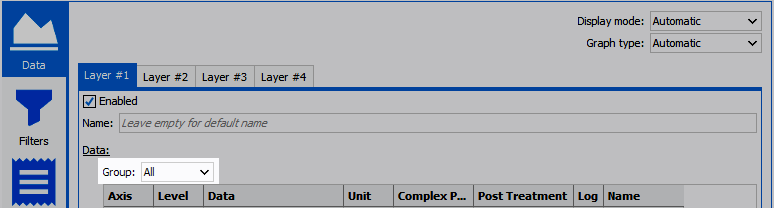
Many templates are available to configure and visualize different data in this Graph.