
Table
Overview
The ( ) icon allows to insert a
'Table' control into the whiteboard. 'Table' control can be used to display data or
user data from datasource, filter, selector or extractor in tabular form.
) icon allows to insert a
'Table' control into the whiteboard. 'Table' control can be used to display data or
user data from datasource, filter, selector or extractor in tabular form.
Click on the () icon then anywhere in
the workspace, drag the mouse to delimit the Table.
In its property page, the Table control is composed of two main sections : a common one with the component visual aspect on the workspace, its name, sources, input curves... and a dedicated one, where the control behaviour is described, in which there is three different tabs.
Content
This section will describe the main tab of the control.
Regardless of the Table control configuration, three buttons are available to manage data, located in the bottom left.
![]() adds a new entry
line,
adds a new entry
line, ![]() removes any
entry line after having them selected (if every entries have to be deleted,
removes any
entry line after having them selected (if every entries have to be deleted, ![]() can be used).
can be used).
In this section, many configurations are defined in the list named Type.
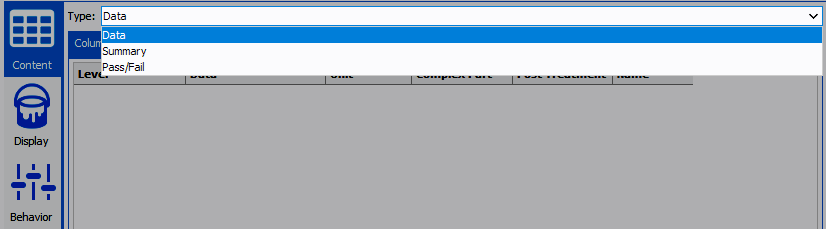
In this scroll bar, three choices are available. They represent three different Table configurations, each one having its own functionalities.
- Data :
In this configuration, the control will behave as a standard table, listing the User's specified data values. It is parametrized in the "Columns" tab as follows :
The first colum named "Level" lists the file levels, in accordance with the nature of the file measurement. For example, if the file involves one tone measurements, the level proposed will be 'f0', if the file involves two tones measurement, the levels proposed will be '2f1 - f2', 'f1', 'f2' and '2f2 - f1' and the same principle is kept with the addition of more tones. Each type of measurement will propose different set of levels. If the data does not have this information, the level will then be set to 'default'.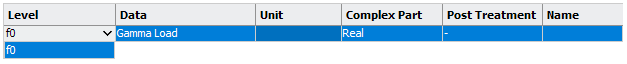 The second column named "Data" lists every data name contained in the source file. Equation names will also appear in this list if specified in the source.
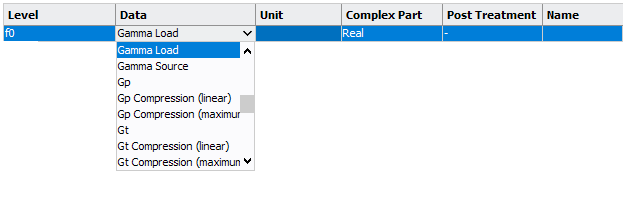 The third column named "Unit" proposes the coherent units (if relevant) and the units in which the data can be converted to. The data value read in the source file will be converted by the Table control and displayed in the specified unit.
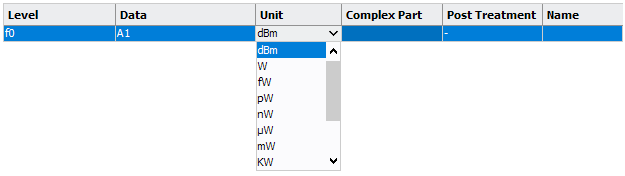 The fourth column named "Complex Part" proposes the possible extractions if the data is recognised as a cartesian or polar value.
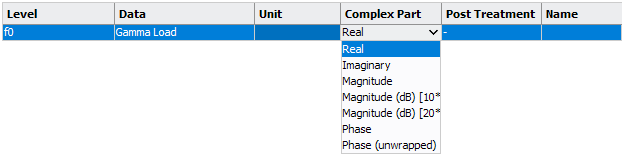 The fifth column named "Post Treatment" is used to specify if the sign of the data has to be inverted or not.
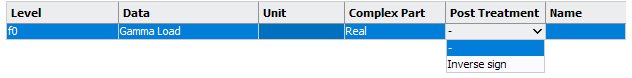 The sixth and last column named "Name" is used to specify a custom data name. If a name is specified, it will automatically replace the generated one.
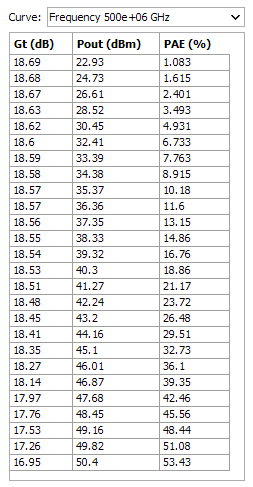
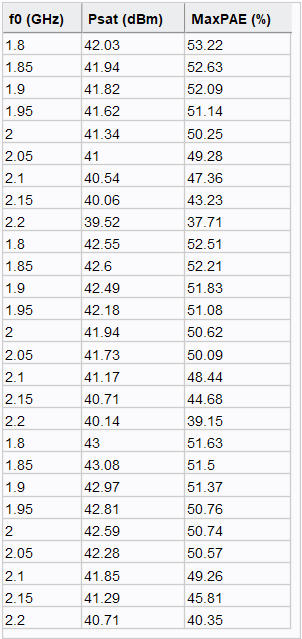
This will result in : In the Settings tab, two elements can be parametrized. The first concerns the curve listing display, that will show, if checked, a list of all the curves received by the control. For example, if the input file is a 1-tone measurement, a list of frequencies will be displayed :
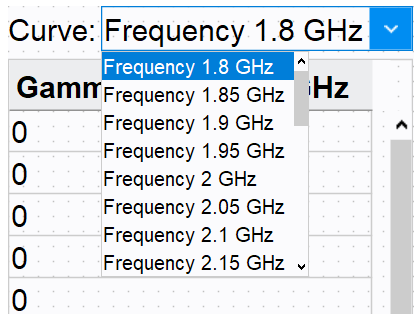 The second parameter named "Subcurve level to extract", is used to set as output the level selected data in the list, none means no output.
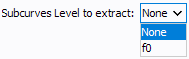
Clicking the desired lines in the table will select data to output from the control. This data will be the curve(s) containing the selected element(s), not only the value(s) written in the control. This can easily be visualized by defining a table as source of a graph :
- Summary :
In this configuration, the control will behave as a standard table previously described, in addition with two more parameters. It is parametrized in the "Columns" tab as follows :
The first colum named "Source" is used to precise if the input is a Data or a Variable. If the input is a Data, then the second column if available to define the type of operation to apply to the data.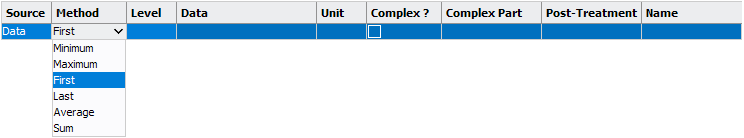
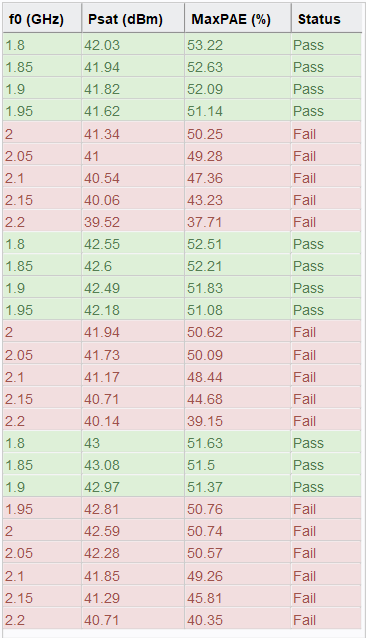
- Pass / Fail :
In this configuration, the control will behave as a Summary table previously described, in addition with two more parameters. It will decide for each data if the specifications are reached and set the corresponding status to Pass or Fail.
It is parametrized in the "Columns" tab as it would be in a standard data visualisation, with an add-on concerning the coloration of the cell when a Pass or Fail is done. In the Filters tab are defined all the filters that can be applied to the data. This tab can be totally different than the Columns tab regarding the tests needed.
The value column is used when the test is done with one boundary, otherwise, Min and Max are used. Precision is the number of digits to take into account for the comparison.In the Settings tab one can specify to remove the lines of data that did not pass the test by unchecking "Remove filtered curves". It can also be specified to show / hide the Pass / Fail column, and change the text displayed in the status field.
Display
- Text : here can be defined the text (cells) font, color and background.
- Header : here can be defined the header (title) text font, color and background.
- Border : here can be defined the border color and line type.
- Number Notation : here can be defined several parameters. The display mode (automatic, plain (with no comma), scientific and engineering), a precision order (number of digits after comma to print) and two checkboxes, one for adaptative precision (rounds the number automatically) and force sign to force the sign display (usefull if the '+' sign must appear).
Behavior
In this section, the behaviour of the control can be defined. Checking the Multi-Selection box allows to select multiple data lines in the control, otherwise, only one line can be selected at a time.