
NPR Real-Time Measurement Display
The configuration of windows display, history, visualization profile and Graph Configuration for NPR signal graphs is similar to the 1-Tone Real-Time Measurement Display.
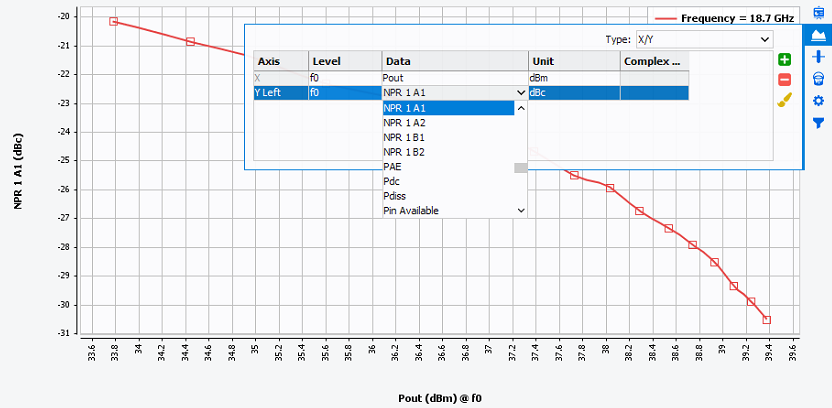
Noise Power Ratio (NPR)
The NPR curve relative to the VNA receiver can be displayed. This data is available in the graph when configured as a 2D Graph. In order to see the NPR on the specific receiver during the measurement select the 2D Graph Mode then the correct data in theGraph Configuration :
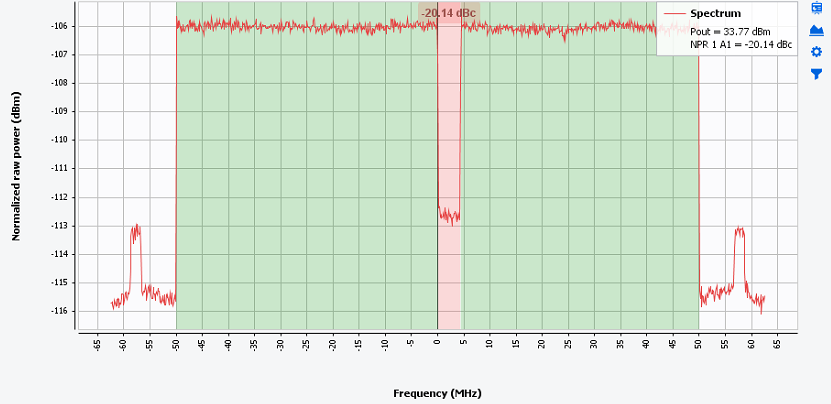
A1, B1, A2, B2 waves spectrums
For each measurement condition, the complete spectrum traces are saved for each wave
and can be displayed. In order to see the waves spectrum during the measurement
select Trace Graph Mode then the corresponding trace in theGraph Configuration :
Adjacent Channel Power Ratio (ACPR)
Regarding the definition of the ACP template, IQSTAR displays ACPR (lower/upper) for each adjacent channels described.
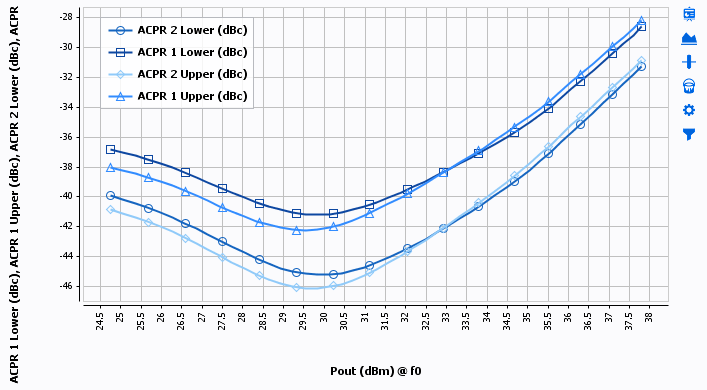
Note: The name of each ACPR will respect the numbering defined in the offset
settings of Adjacent Channel Power Ratio (ACPR).
Note: The ACPR data can also appear alongside with the NPR data on the spectrums
following the IQSTAR configuration.