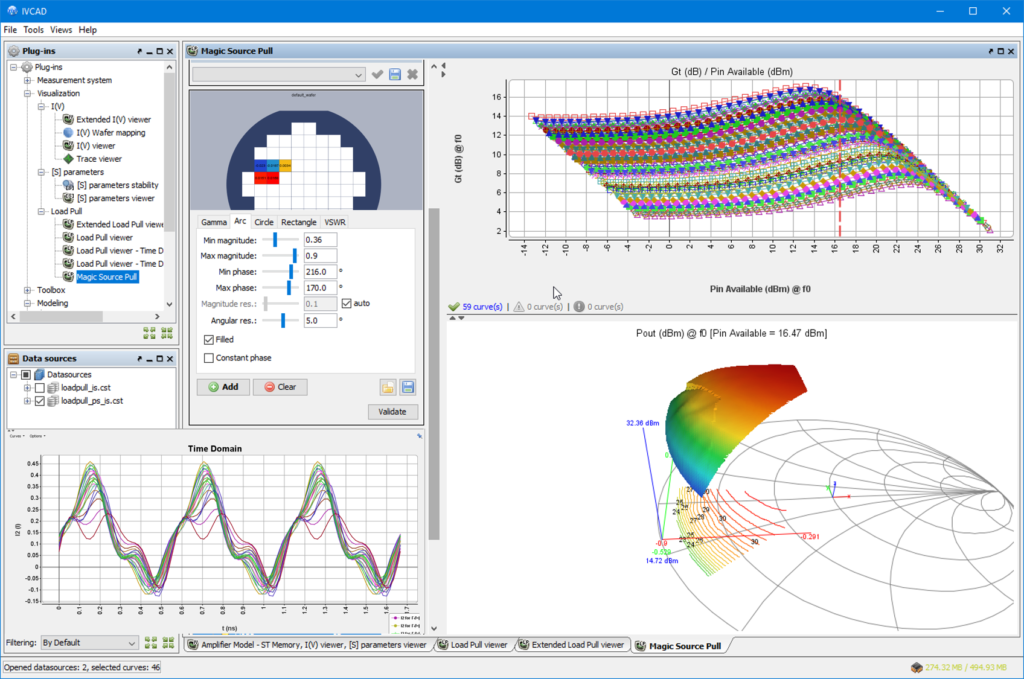
IVCAD MT930B2 offers a real time post processing visualization capabilities
- Extended I(V) Viewer allows Dynamic pulsed IV visualization, as a function of time, to check measurement relevance and observe critical data variation such as dynamic self-heating.
- I(V) wafer Mapping uses I(V) data to observe the spread of DUT DC performances at wafer scale for interpolated parameters.
- Advanced S Parameter Viewer allows plotting stability, operating and Maximum Gain circles as function of frequency or bias parameters.
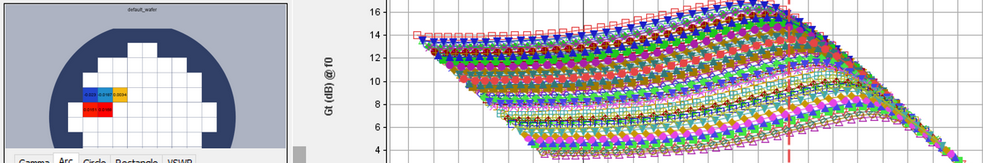
- Extended Load Pull Viewer plots interpolated load pull contours versus power levels; time domain load pull waveforms and, thanks to a patented ‘Magic Source pull’ process, it can dynamically emulate equivalent source pull measurements such as the transistor’s transducer gain.