Getting Started: "Overview on 3-Tones Measurement Techniques"
The 3-Tones measurement is a measurement technique used to capture the low frequencies / long-term memory effects lead by the biasing circuit, the thermal phenomenas and / or the trapping effects of the device. In this context, the main application is to extract the behavioral model of the DUT. Such a measurement is not possible to interpret traight away as its main purpose it to be injected as a VISION U-HFLF model, alongside with a 1-Tone characterization.
The three tones signal is generated as a waveform file, which is sent to the RF source. In order to do this, the instrument needs the options to be able to read a waveform and generate it.
Two waveforms will be generated for one measurement point, each of one will have a specific phase between the carrier and the delta tones. The goal is two have two orthogonal waveforms for the model to be extracted later. These settings are not manageable by the user in IQSTAR and are always used as defined (90 and 270° phased tones measurements).
CW Measurements
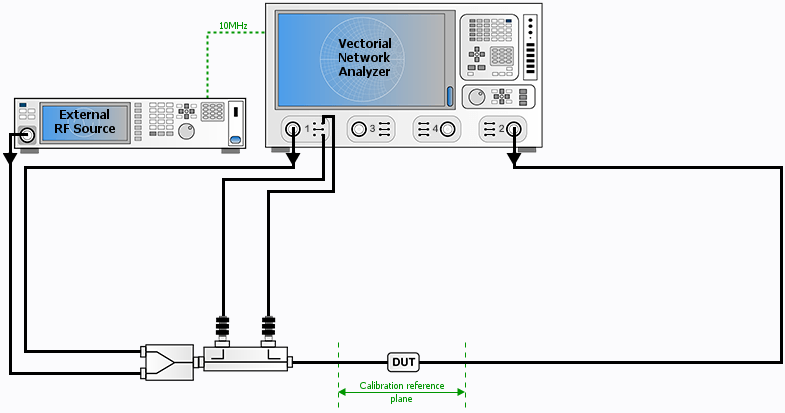
Setup and calibration:
In this type of measurement, every instrument is used in CW, meaning no specific option is required.
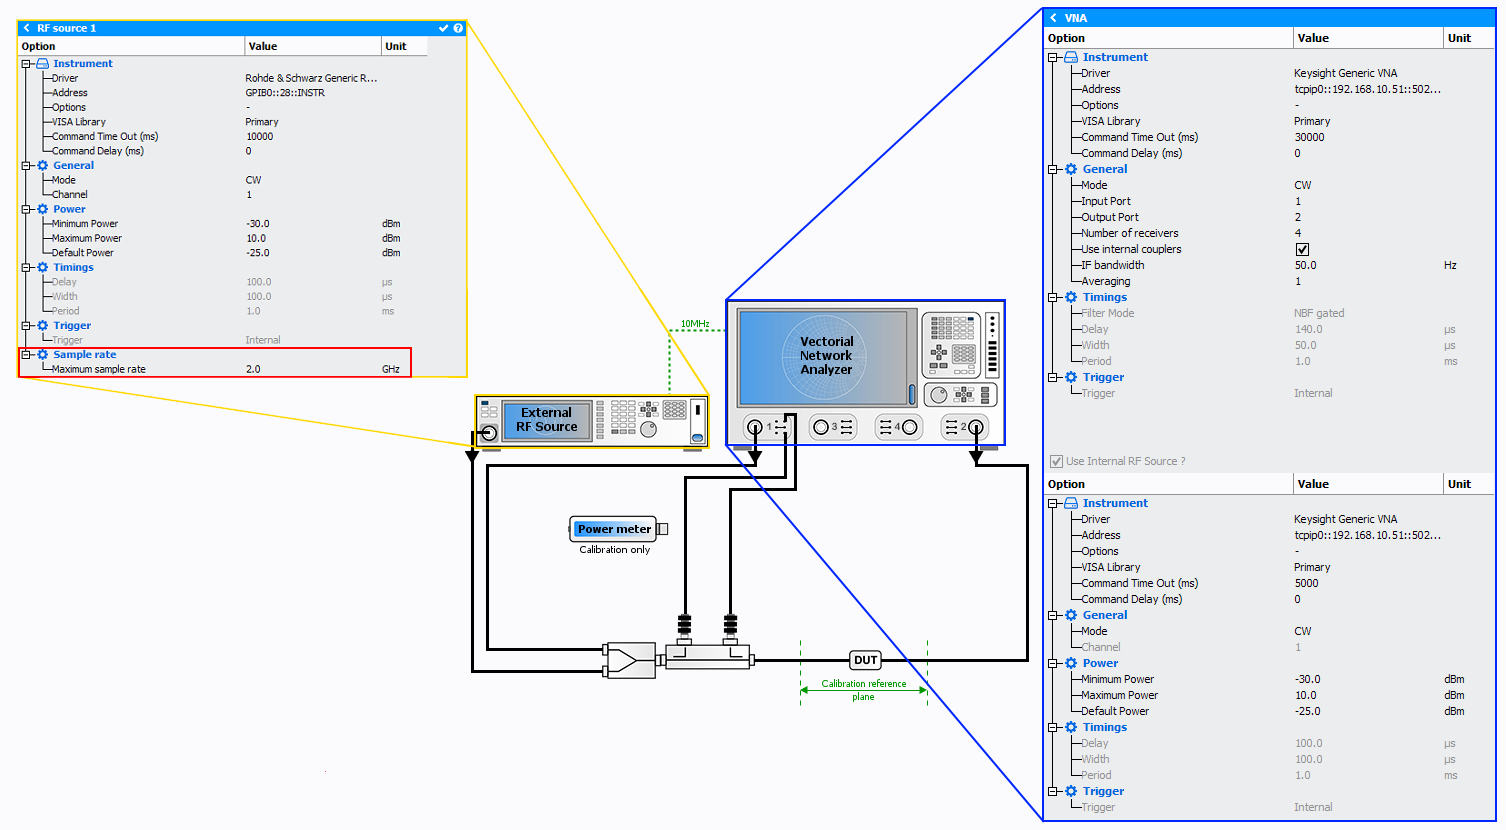
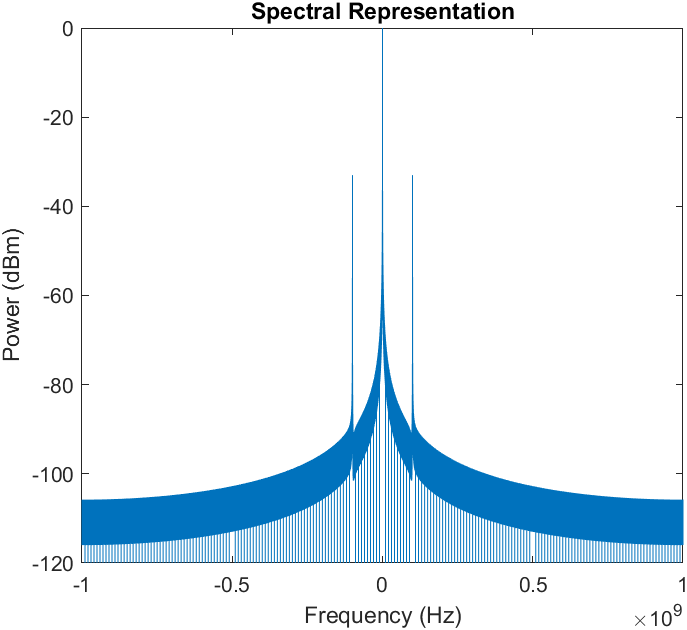
The most important setting in the RF Source configuration is the Maximum Sampling Rate. This value is directly related to the maximum spacing between the tones as the maximum spacing between the delta tones is equal to the maximum sampling rate.
The VNA and power meter settings are the same as in a traditional 1-Tone Measurements.
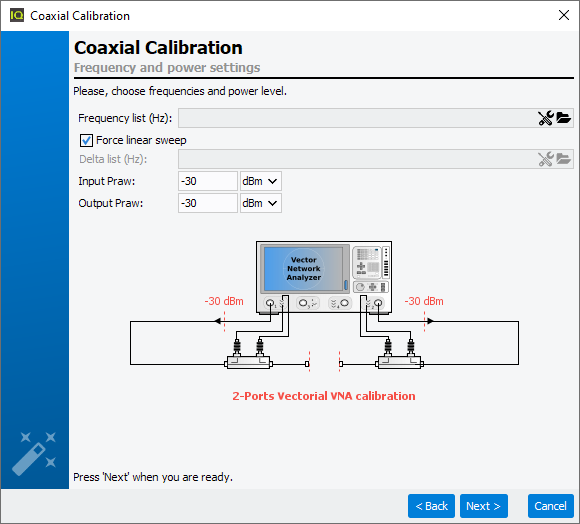
There is two ways of specifying the frequencies to calibrate here. With the "Force linear sweep" option checked, only the frequency list will be calibrated (in red bellow) whereas with this option unchecked, the frequencies in the Frequency list will be calibrated as well as those frequencies plus or minus the Delta list values (in green bellow).
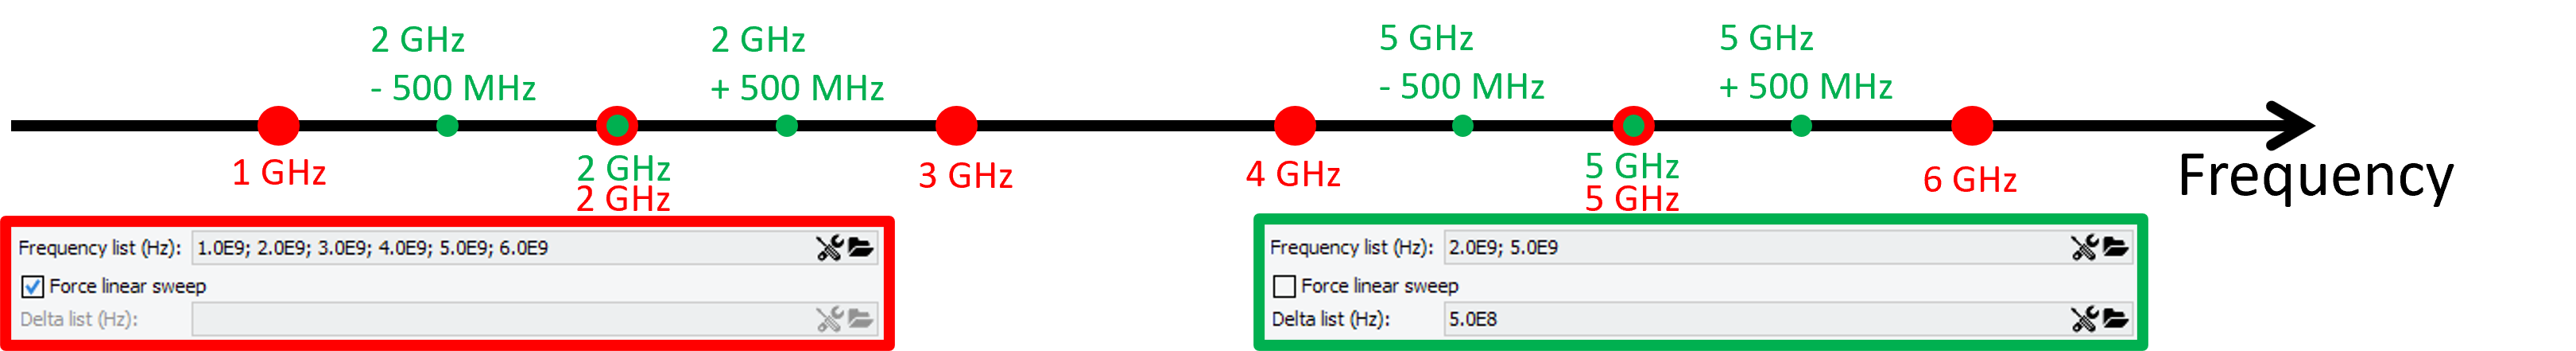
- First case: the measurement is known and there will be no need to measure at other frequencies than specified, so the frequency and delta lists can be used.
- Second case: the measurement is not known are subject to change, so the best way is to calibrated on a broad range with a "mesh size" quite small for better interpolation but keeping in mind the time vs number of points tradeoff.
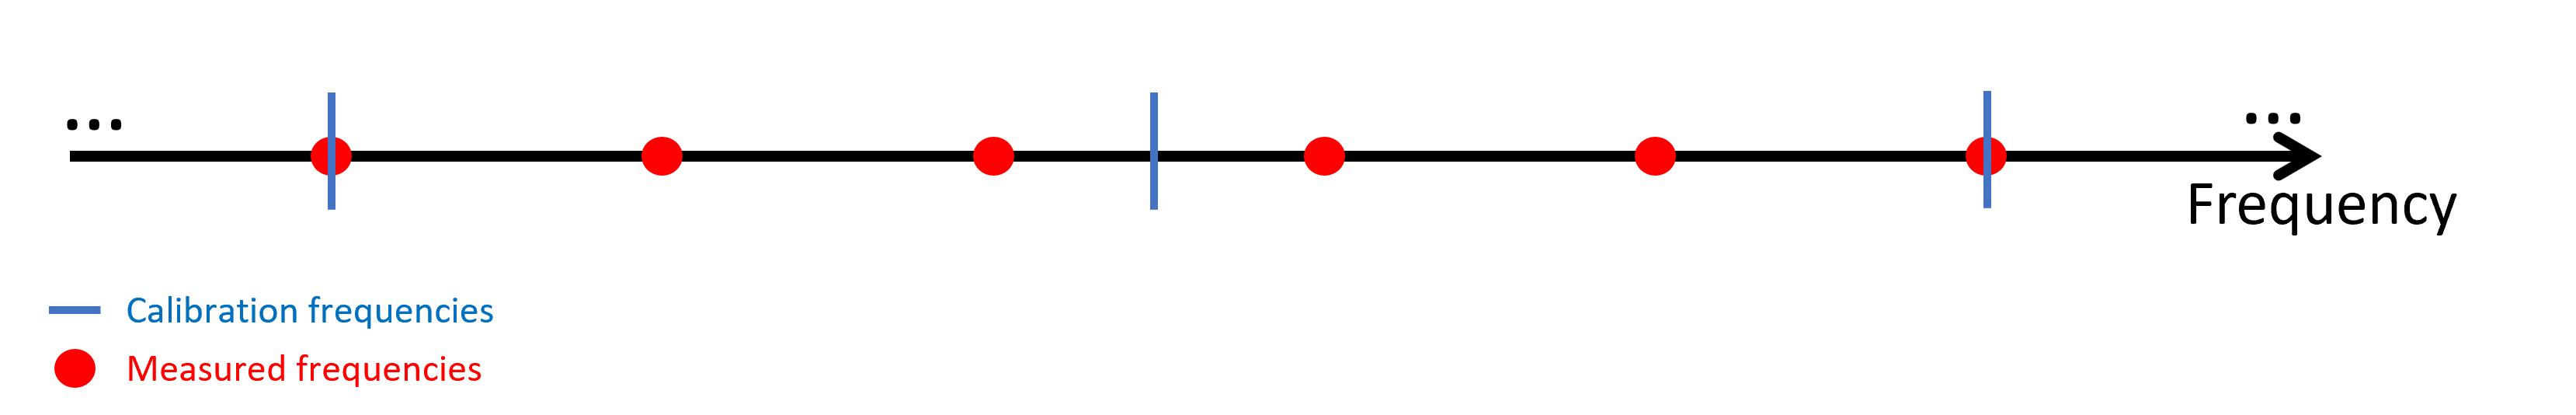
In order to compensate this issue, the best way is to reduce the mesh step in order to be in the same order of magnitude of the measured frequencies steps.
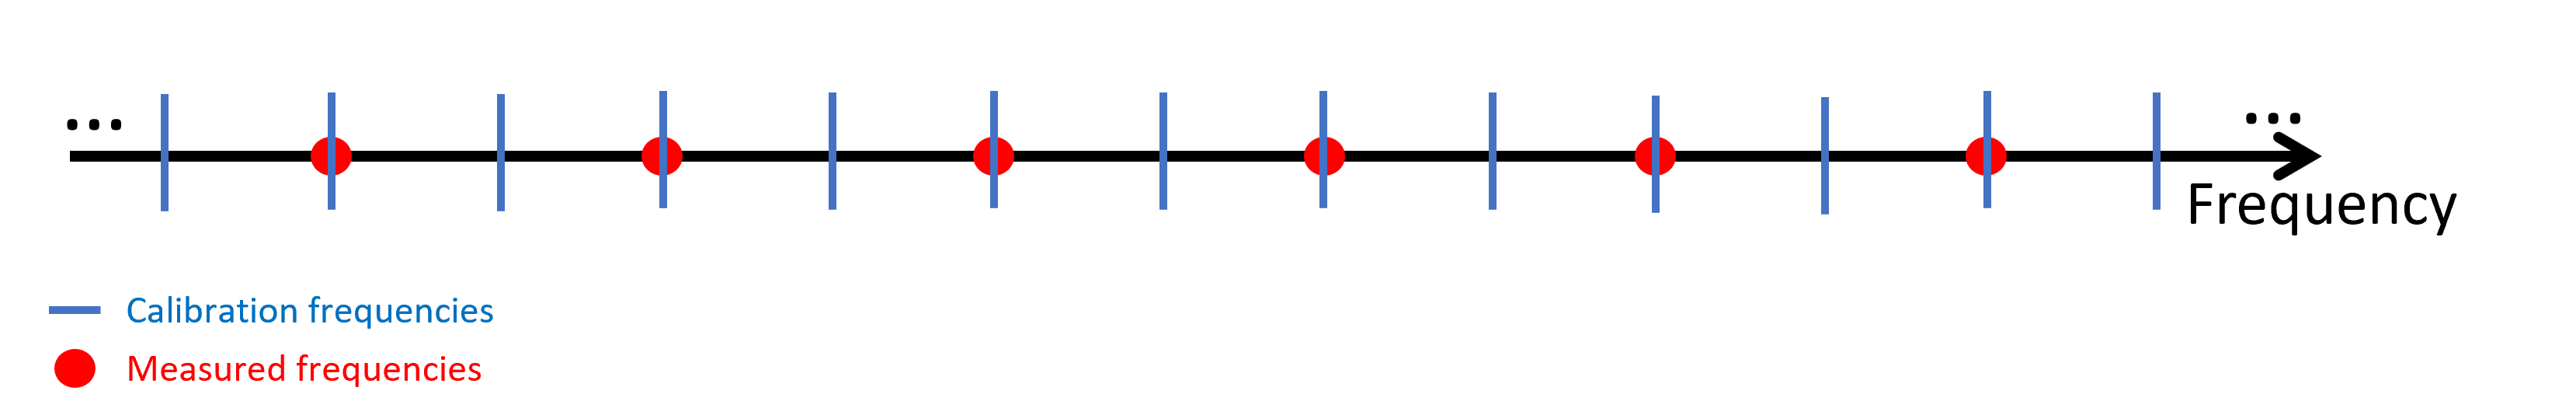
As in general, the three tones mesurement is run with a delta starting at some hundreds of kilohertz or some megahertz, the linear calibration step can be set at a few megahertz.
After having done the vectorial calibration, a standard amplitude calibration needs to be performed. Either the VNA source or the main RF source can be used to perform this calibration.
The setup is now calibrated and ready to be initialized.
Pulsed Measurements
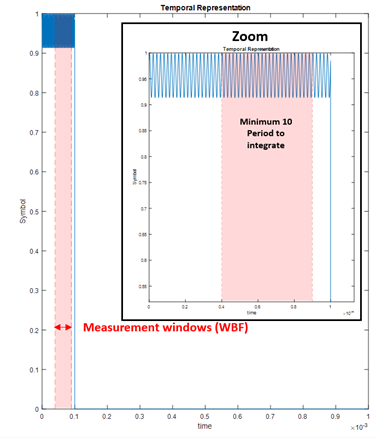
With this principle, the main difficulty will be to reduce the delta between the tones, as the cardinal sinues around the tones will quickly start to impact a large portion of the useful signal information.
In this context, a relationship can be defined between the minimum pulse width measurable and the minimum delta between the tones : Delta min = 10 / Pulse measurement windows.