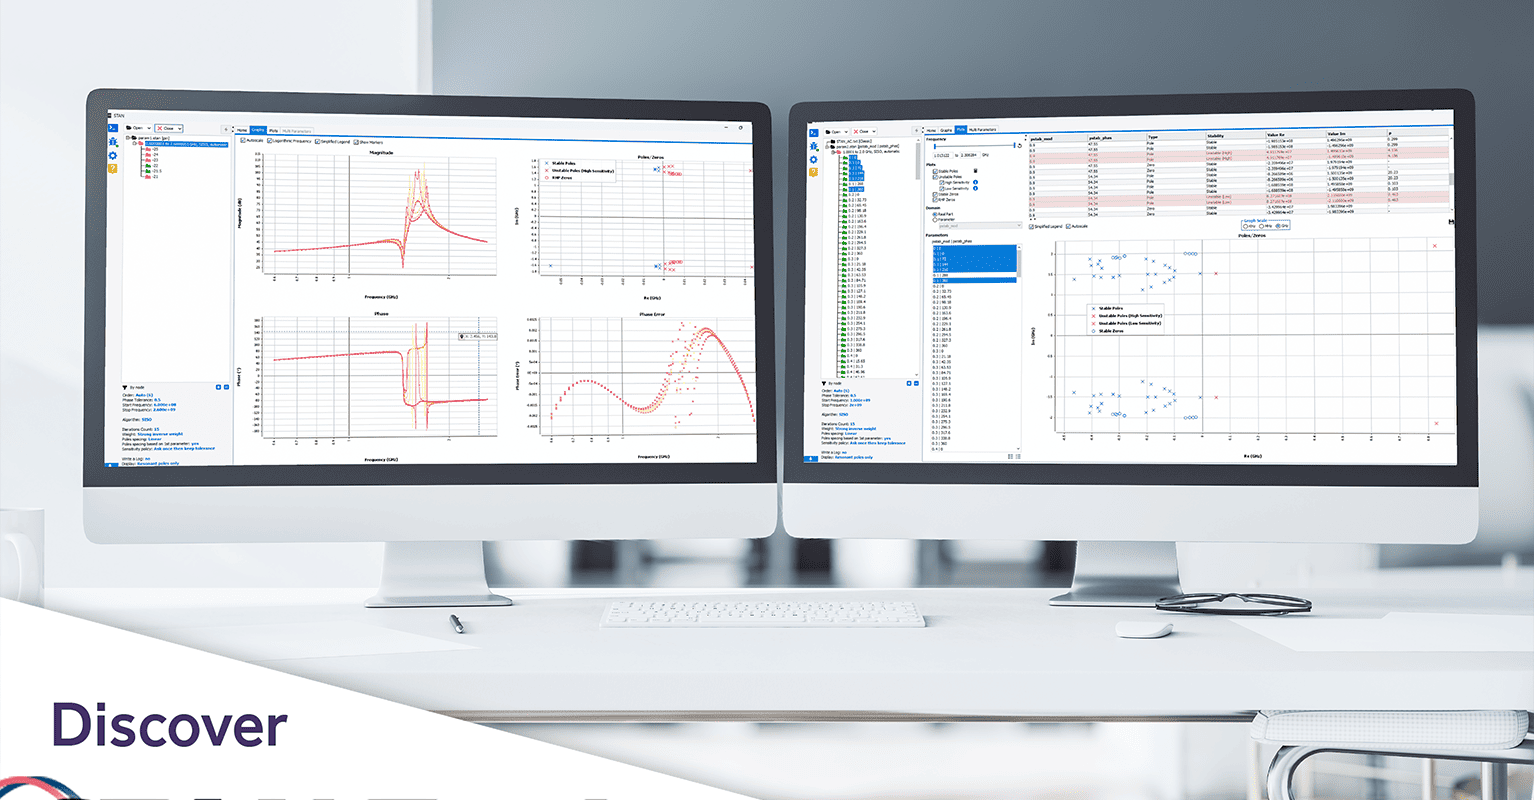
AMCAD Engineering announces the released version of STAN 2.0, which is a rigorous and unique stability analysis based on pole-zero identification technique. STAN Tool offers a stability analysis technique of microwave circuits, valid for small-signal and large-signal regimes. A pole-zero identification method is a powerful tool based on a rigorous and unique analysis compared to other alternative stability methods which are limited and more complex to set up. Thanks to pole-zero identification, the designer obtains more insight into the circuit dynamics, giving information about the nature/ location of the oscillations.
STAN 2.0 is now a standalone application, offering customers the option of working under Windows or Linux environment. A built-in script server is available to allow the control of the application from a third-party software.
Based on customer feedback, this major release incorporates new features to drastically secure and reduce the analysis time for the two available algorithms and improve the user experience.
STAN 2.0 Main Improvement
New user interface
To enhance the user’s experience a modern UI with configurable theme, faster interface and graphs response is implemented. Among the changes, a non-exhaustive list of interface modifications is given below:
- Improved graphic performances (zoom, autoscale, displacement)
- Markers point size reduction
- Summarize table of Poles/zeros modifications
- Colour gradient according to selection until 5 selections
- Check box for Selected All/ Unselect All
- Identification information in the tree and in the insert below the tree
- Drag and drop functionality
- Improvement of the graphic legends
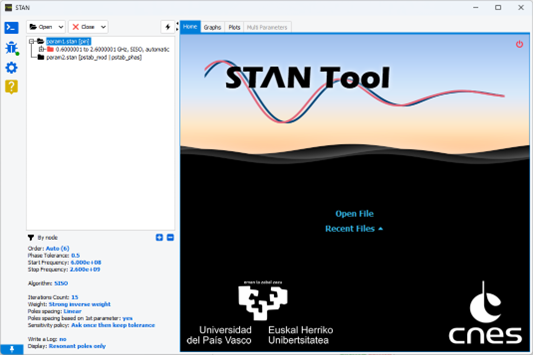
Major interface changes lie in the home page, the aspect and capabilities of the graphs, and access to analysis configurations.
A home page allows opening files and see the recent files identified. Drag and drop functionality is enabled in the home page and the tree to quickly open a simulation file (*.txt, *.stan). In addition, the configuration chosen for identification once the analysis has been carried out can be accessed quickly, to enable the user to have a quick view of the configuration settings corresponding to the analysis results displayed. They are available both in the analysis selection tree and in an insert below the identification. It is possible to retrieve the order used for the identification, the phase tolerance set, the frequency range analysed, as well as the algorithm and many other options.
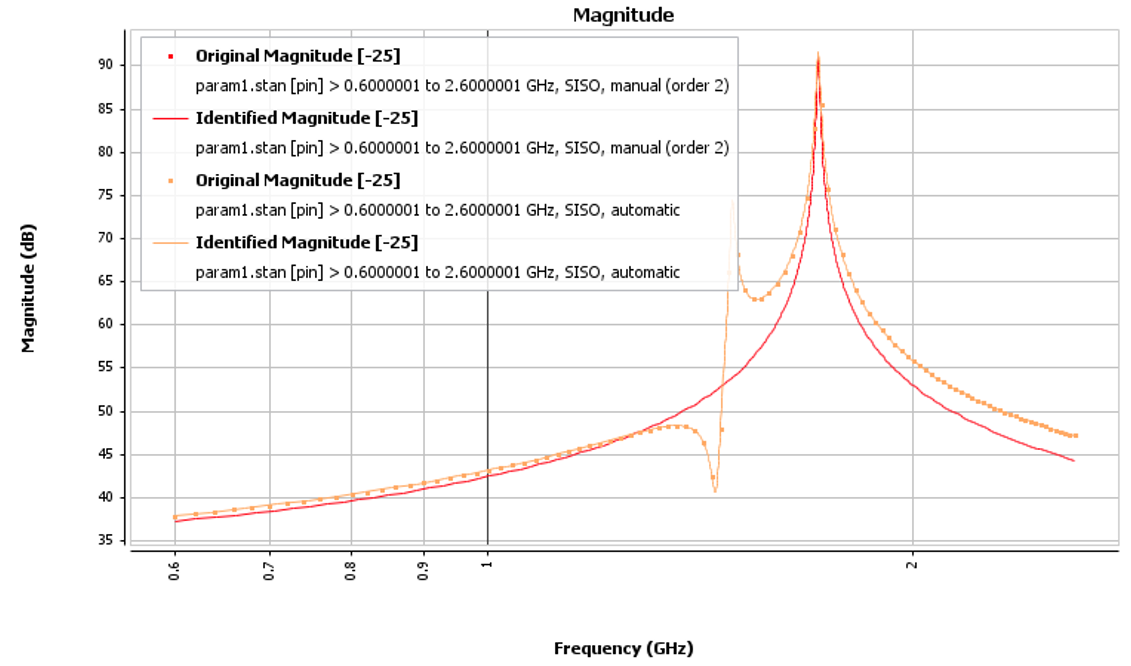
Graphics appearance is improved from the previous version to allow a better visualization of the identified transfer function (show markers box to disable the original transfer function) and for pole-zero maps. The graph legends are upgraded to give more information on the analysis (parameter name, frequency band, algorithm, order), especially if different analyses are selected. This makes comparison between different identification configurations or parametric simulation files more intuitive.
Analysis time reduction
In this new STAN version, the analysis speed has been strongly increased for the two algorithms present in the software: SISO (Single Input Single Output) and DACWIN (Divide And Conquer With Noise method). The more complex the analysis (numerous modification slope in transfer function, high number of parameters, …) the greater the reduction in analysis time. It has been observed that, for certain files, the analysis could previously take five minutes, whereas now, for the same file and the same configuration, it barely takes a minute. It is always possible to see the progress of the analysis and we have added the option of access to the total analysis time when it is finished.

STAN 2.0 Main Improvement
CSV Export
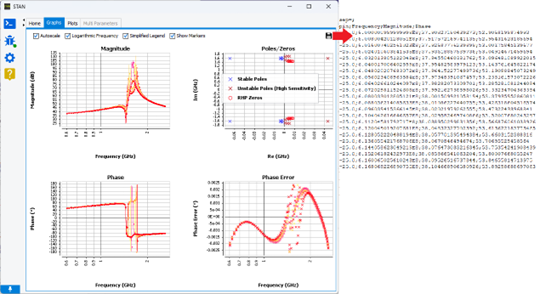
In previous versions exported identified transfer function was feasible thanks to scripting. From now, this capability is incorporated in the STAN user interface, and the identified function in magnitude and phase can be exported in a *.csv format file. From the plot Tab, the table summarizes the poles/zeros maps as well as the sensitivity factor are exportable in csv format.
Sensitivity factor for real poles
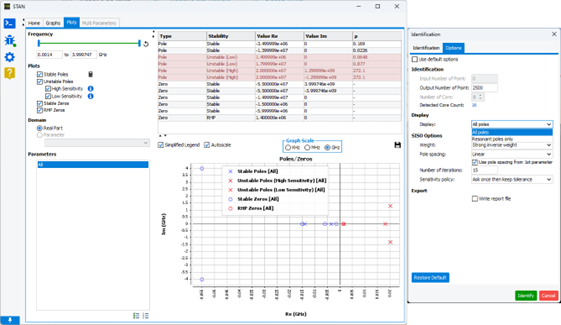
Sensitivity factor (ρ) calculated during the residue analysis (SISO method) is a useful ingredient in STAN to classify the poles observability. This factor is determined for all poles and allow to sort out the unstable poles in three categories: high sensitivity, low-sensitivity and very low sensitivity. Thanks to a recent publication (“Understanding the Effect of Long-Term Memory Model Parameters in Pole-Zero Identification for Stability Analysis of Power Amplifiers”), the ρ calculus has been revised for the real poles (imaginary part equal to 0).
Multi-Parameter analysis
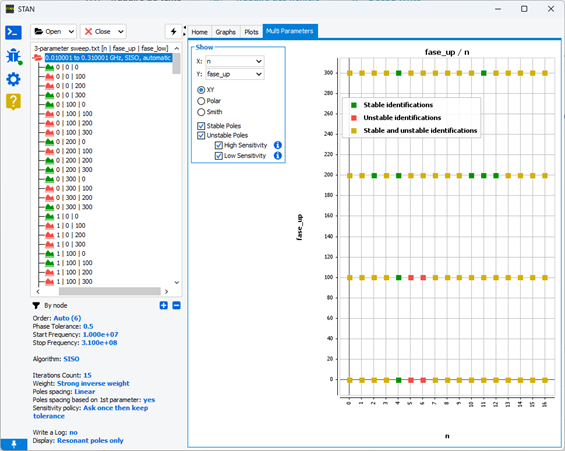
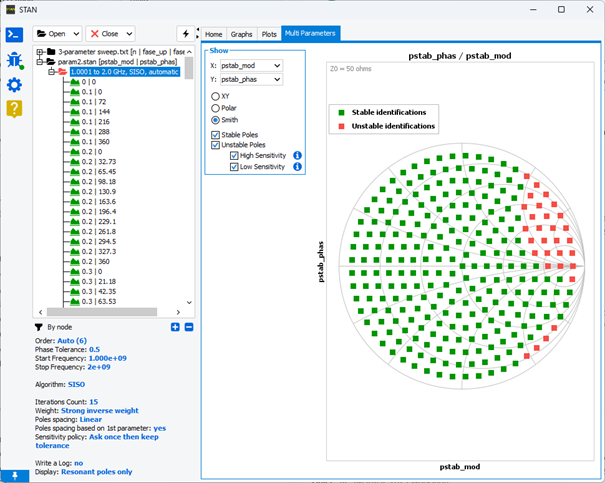
STAN is compatible and can be combined with commercial software and offers the potentiality to analyse parametric, multi-node or Monte-Carlo simulations in the same way. Multi-parameter tab support analysis for a few swept parameters/nodes higher than two. Using this tool enables intuitive and practical pole mapping in the form of X/Y, Smith or Polar graphics. A checkbox menu has been added to quickly observe the mapping of instabilities according to their observability.
We would like to thank our customers for their feedback, which helps us to ameliorate and incorporate new features in this STAN release. We would like to express gratitude to Universidad del Pais Vasco and CNES for their invaluable help in developing this new version of the software. A more detailed list of all new modules, features, enhancements and bug fixes can be found in the STAN product manual, available with the software installation program.

